ファイル:Radar-bright-band.png
高解像度版はありません。
Radar-bright-band.png (791 × 449 ピクセル、ファイルサイズ: 263キロバイト、MIME タイプ: image/png)
ウィキメディア・コモンズのファイルページにある説明を、以下に表示します。
|
概要
| 解説 |
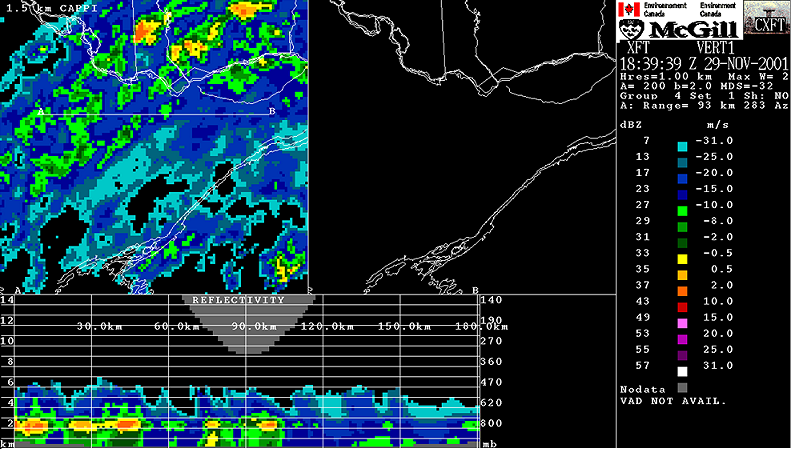
Français : En haut, CAPPI de 1,5km d'altitude montrent de forts échos radar, en jaune, parmi des échos plus faibles en vert. Dans la partie du bas, la coupe verticale à travers les données radar montre que ces intensités sont dues à la présence d'une zone de réflectivité plus intense se situant entre 1,5 km à 2,5 km d'altitude. Cette bande brillante est causée par de la neige fondante.
English: Snow falling through the freezing level will melt and reach the ground as rain. On this image, at the top we can see a CAPPI of precipitations. At the bottom, there is a cross-section of the radar data from ground to 15 km. One can see a level where echos are stronger: the bright-band. The melting begin to occur just above this band and continue until its lower part. This effect is due to the fact that the reflectivity depend on the 6th power of the diameter of targets multiplied by its ability to reflect. Snow flakes are much larger than rain drops but they reflect much less so echos from snow and rain have intensities relatively close. However, when snow melt, it keeps its diameter for a while and get coated with water. The radar beam sees something similar to a very larger water dropplet and the return is producing this very strong band. |
| 日付 | 1839 UTC |
| 原典 |
English: Meteorological Service of Canada (Environment Canada). Redistribution allowed if source mentionned |
| 作者 |
Français : Ce radar est opéré par Environnement Canada. La sortie radar est produite par le logiciel développé par l'Observatoire radar J.S. Marshall de l'Université McGill en collaboration avec EC. |
ライセンス

|
このファイルの著作者は、著作者の帰属を適切に表示することを条件に、あらゆる目的でこのファイルを使用することを許可しています。再頒布、二次的著作物の制作、商用利用、その他あらゆる利用が許可されています。 |
|
|
ファイルの履歴
過去の版のファイルを表示するには、その版の日時をクリックしてください。
| 日付と時刻 | サムネイル | 寸法 | 利用者 | コメント | |
|---|---|---|---|---|---|
| 現在の版 | 2006年5月8日 (月) 15:20 | | 791 × 449 (263キロバイト) | Pierre cb | Snow falling through the freezing level will melt and reach the ground as rain. On this image, at the top we can see a CAPPI of precipitations. At the bottom, there is a cross-section of the radar data from ground to 15 km. On can see a level where echos |
ファイルの使用状況
以下のページがこのファイルを使用しています:
グローバルなファイル使用状況
以下に挙げる他のウィキがこの画像を使っています:
- en.wikipedia.org での使用状況
- es.wikipedia.org での使用状況
- fr.wikipedia.org での使用状況
- he.wikipedia.org での使用状況