ファイル:Sauerstoffgehalt-1000mj2.png

元のファイル (2,000 × 1,409 ピクセル、ファイルサイズ: 74キロバイト、MIME タイプ: image/png)
ウィキメディア・コモンズのファイルページにある説明を、以下に表示します。
|
| 解説 |
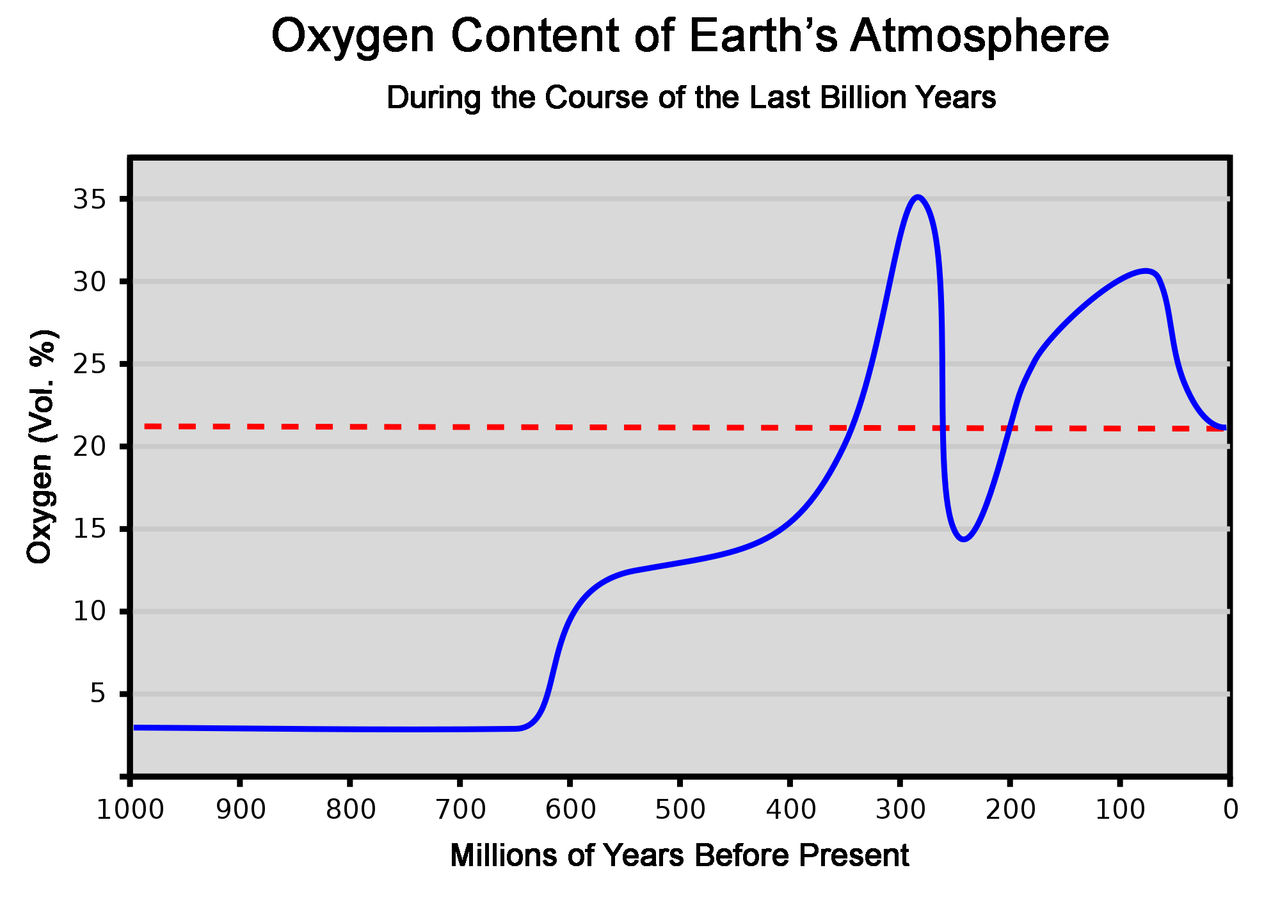
This graph represents the concentration of oxygen in the atmosphere over the last 1000 million years. As a reference, the dashed red line shows the present concentration of 21%. It should be noted that the O2 concentration variation which occurred in past periods can often be estimated only relatively coarsely. Therefore, the chart makes no claim to accuracy, but can only give a broad overview of change at the level of geological periods. This chart is based on the averaged data of several publications. [1][2] Explanation of the curve: After having already begun in the Precambrian, the outgassing of oxygen from the oceans caused atmospheric oxygen to jump from 3% to 12% around the beginning of the Cambrian, because by then all oxygen sinks were finally saturated. Around the same time, the Cambrian explosion took place. During the Silurian and Devonian plants spread over the land, while the animal kingdom was still almost exclusively confined to the water. This caused a further rapid and continuous increase of the oxygen concentration. In the following period carbon burial brought the oxygen level to 35%,[3] thus favoring overgrowth especially in insects. Amphibians and early reptiles were now present on land. Massive volcanic activity at the Permian-Triassic transition caused not only a decline of the oxygen content to 15%, but also the largest mass extinction in geological history. The oxygen concentration then recovered over a long period and reached 26% again by the middle of the Jurassic, and probably even rose to 30% in the Cretaceous. During this time the largest dinosaurs evolved. The end of the Cretaceous period is marked by an impact event, with climate change and a mass extinction. The oxygen level was only 23% 40 million years ago, and had reached the present value of 21% by 25 million years ago. Since then the level has remained constant, apart from fluctuations in the per thousand range. |
| 日付 | (UTC) |
| 原典 | |
| 作者 |
|
| その他のバージョン | このファイルの派生的著作物: OxygenLevel-1000ma.svg |
この画像には画像編集が施されています。原本に対して次のデジタル的な変更が行われました。
|
| この著作物の著作権者である私は、この著作物における権利を放棄しパブリックドメインとします。これは全世界で適用されます。 一部の国では、これが法的に可能ではない場合があります。その場合は、次のように宣言します。 私は、あらゆる人に対して、法により必要とされている条件を除き、如何なる条件も課すことなく、あらゆる目的のためにこの著作物を使用する権利を与えます。 |
元のアップロードログ
This image is a derivative work of the following images:
- File:Sauerstoffgehalt-1000mj.svg licensed with PD-self
- 2007-10-27T01:17:42Z LordToran 744x524 (41527 Bytes) '
- 2007-07-23T00:08:15Z LordToran 744x524 (42518 Bytes) == Beschreibung == {{Information |Description=Dieses Diagramm stellt die Sauerstoffkonzentration in der Erdatmosphäre im Lauf der letzten Jahrmilliarde dar. Es ist anzumerken, dass die Zeiträume, in denen vergangene Schwan
- 2007-07-17T23:57:50Z LordToran 744x524 (41203 Bytes) {{Information |Description=Dieses Diagramm stellt die Sauerstoffkonzentration in der Erdatmosphäre im Lauf der letzten Jahrmilliarde dar. |Source=Selbst erstellt |Date=2007-07-18 |Author=[http://de.wikipedia.org/wiki/Benutze
Uploaded with derivativeFX
ファイルの履歴
過去の版のファイルを表示するには、その版の日時をクリックしてください。
| 日付と時刻 | サムネイル | 寸法 | 利用者 | コメント | |
|---|---|---|---|---|---|
| 現在の版 | 2010年3月11日 (木) 10:31 | | 2,000 × 1,409 (74キロバイト) | WolfmanSF | {{Information |Description=Dieses Diagramm stellt die Sauerstoffkonzentration in der Erdatmosphäre im Lauf der letzten Jahrmilliarde dar. Als Referenz zeigt die gestrichelte rote Linie die heutige Konzentration von 21% an. Es ist anzumerken, dass die Ze |
ファイルの使用状況
グローバルなファイル使用状況
以下に挙げる他のウィキがこの画像を使っています:
- cdo.wikipedia.org での使用状況
- en.wikipedia.org での使用状況
- fi.wikipedia.org での使用状況
- ha.wikipedia.org での使用状況
- hr.wikipedia.org での使用状況
- mk.wikipedia.org での使用状況
- no.wikipedia.org での使用状況
- pt.wikipedia.org での使用状況
- ru.wikipedia.org での使用状況
- sh.wikipedia.org での使用状況
- simple.wikipedia.org での使用状況
- sk.wikipedia.org での使用状況
- sr.wikipedia.org での使用状況
- sv.wikipedia.org での使用状況
- uk.wikipedia.org での使用状況
- www.wikidata.org での使用状況
- zh.wikipedia.org での使用状況