ファイル:ShockleyQueisserVOC.svg

この SVG ファイルのこの PNG プレビューのサイズ: 608 × 600 ピクセル. その他の解像度: 243 × 240 ピクセル | 487 × 480 ピクセル | 778 × 768 ピクセル | 1,038 × 1,024 ピクセル | 2,076 × 2,048 ピクセル | 742 × 732 ピクセル。
元のファイル (SVG ファイル、742 × 732 ピクセル、ファイルサイズ: 27キロバイト)
ウィキメディア・コモンズのファイルページにある説明を、以下に表示します。
|
概要
| 解説 |
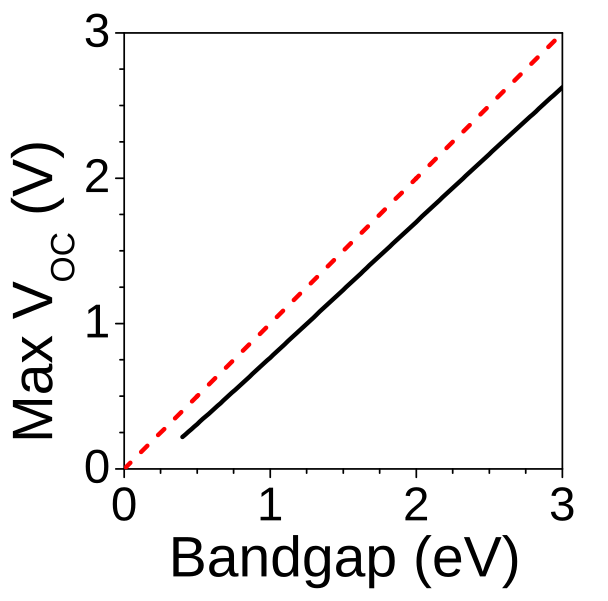
English: Black curve: The limit for the maximum open-circuit current of a solar cell within the Shockley-Queisser model. The x-axis is the bandgap of the solar cell in electron volts, the y-axis is the highest possible open-circuit voltage in volts. The red dotted line is "y=x", showing that the open-circuit voltage is always somewhat smaller than the bandgap voltage. (The model assumes a single-junction solar cell under unconcentrated light, and some other assumptions too. I used the AM1.5G solar spectrum data for the calculation.) I cross-checked my curve with an independently-calculated one and they agree to high accuracy, see Practical Handbook of Photovoltaics p129.
Русский: Черная линия — предел максимального напряжения холостого хода солнечного элемента в модели Шокли — Кейсера. По оси X отложена запрещенная зона солнечного элемента в электрон-вольтах, по оси Y — максимально возможное напряжение холостого хода в вольтах. Красная пунктирная линия — «y=x», проведена для иллюстрации, что напряжение холостого хода всегда несколько меньше напряжения запрещенной зоны. |
| 日付 | |
| 原典 | 投稿者自身による著作物 |
| 作者 | Sbyrnes321 |
| その他のバージョン |
|


I did the calculation in Mathematica, plotted it in Origin, and did PDF-->SVG conversion in Inkscape. Then a few years later, I ported the code from Mathematica to Python, and you can now see the whole calculation and results at https://github.com/sbyrnes321/SolarCellEfficiencyLimits/blob/master/sq.ipynb
ライセンス
| この著作物の著作権者である私は、この著作物における権利を放棄しパブリックドメインとします。これは全世界で適用されます。 一部の国では、これが法的に可能ではない場合があります。その場合は、次のように宣言します。 私は、あらゆる人に対して、法により必要とされている条件を除き、如何なる条件も課すことなく、あらゆる目的のためにこの著作物を使用する権利を与えます。 |
ファイルの履歴
過去の版のファイルを表示するには、その版の日時をクリックしてください。
| 日付と時刻 | サムネイル | 寸法 | 利用者 | コメント | |
|---|---|---|---|---|---|
| 現在の版 | 2011年2月9日 (水) 08:30 | | 742 × 732 (27キロバイト) | Sbyrnes321 | {{Information |Description ={{en|1=Black curve: The limit for the maximum open-circuit current of a solar cell within the Shockley-Queisser model. The x-axis is the bandgap of the solar cell in electron volts, the y-axis is the highest possible open-ci |
ファイルの使用状況
以下のページがこのファイルを使用しています:
グローバルなファイル使用状況
以下に挙げる他のウィキがこの画像を使っています:
- ar.wikipedia.org での使用状況
- ca.wikipedia.org での使用状況
- en.wikipedia.org での使用状況
- es.wikipedia.org での使用状況
- pt.wikipedia.org での使用状況