ファイル:Spectral leakage from a sinusoid and rectangular window.png
高解像度版はありません。
Spectral_leakage_from_a_sinusoid_and_rectangular_window.png (508 × 412 ピクセル、ファイルサイズ: 47キロバイト、MIME タイプ: image/png)
ウィキメディア・コモンズのファイルページにある説明を、以下に表示します。
|
en.wikipedia からコモンズに Maksim によって移動されました。
元のファイルページはこちら。以下の利用者は全てen.wikipediaに属します。
概要
| 解説 |
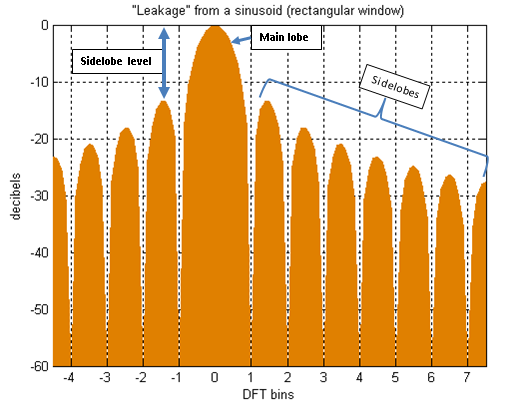
English: This is a portion of the DTFT for a rectangularly-windowed sinusoid. The actual frequency of the sinusoid is indicated as "0" on the horizontal axis. Everything else is leakage. The unit of frequency is "DFT bins"; that is, the integer values on the frequency axis correspond to the frequencies sampled by the DFT. So the figure depicts a case where the actual frequency of the sinusoid happens to coincide with a DFT sample, and the maximum value of the spectrum is accurately measured by that sample. When it misses the maximum value by some amount [up to 1/2 bin], the measurement error is referred to as scalloping loss (inspired by the shape of the peak). But the most interesting thing about this case is that all the other samples coincide with nulls in the true spectrum. (The nulls are actually zero-crossings.) So in this case, the DFT creates the illusion of no leakage. |
|||
| 日付 | ||||
| 原典 | 投稿者自身による著作物 I created this image myself, using Matlab tools and PowerPoint to annotate the graph and create a png file. | |||
| 作者 | Bob K | |||
| 許可 (ファイルの再利用) |
|
|||
| その他のバージョン |
|
|||
| Script | Matlab codeN=128;
k=0:N-1;
dr = 60;
w = ones(1,N);
%
H = abs(fft([w zeros(1,7*N)]));
H = fftshift(H);
H = H/max(H);
H = 20*log10(H);
H = max(-dr,H);
x = -4.5*8 : 7.5*8;
H = H(x + 1+4*N);
%
figure
h = area(x/8,H,'FaceColor', [.871 .49 0], 'Linestyle', 'none')
set(h,'BaseValue',-dr)
ylim([-dr 0])
set(gca,'XTick', -4:7)
grid on
ylabel('decibels')
xlabel('DFT bins')
title('"Leakage" from a sinusoid (rectangular window)')
|


|
この画像 (あるいは、このカテゴリにあるすべての画像)は、ある特定の表記や言語による画像内ラベルや添付された解説文を使用しており、言語に依存しない形式へ変換される余地があります。変換することにより、すべてのウィキメディア・プロジェクト、また何よりも、すべてのウィキメディア言語で使用することができるようになります。
|
| date/time | username | edit summary |
|---|---|---|
| 01:47, 17 December 2005 | en:User:Bob K | (I created this image myself, using Matlab tools.) |
ファイルの履歴
過去の版のファイルを表示するには、その版の日時をクリックしてください。
| 日付と時刻 | サムネイル | 寸法 | 利用者 | コメント | |
|---|---|---|---|---|---|
| 現在の版 | 2011年12月17日 (土) 05:25 | | 508 × 412 (47キロバイト) | Bob K | Remove gray border. Annotate sidelobes, main lobe, sidelobe level. |
| 2006年3月20日 (月) 20:04 |  | 514 × 421 (6キロバイト) | Maksim | La bildo estas kopiita de wikipedia:en. La originala priskribo estas: == Summary == I created this image myself, using Matlab tools. == Licensing == {{PD-self}} {| border="1" ! date/time || username || edit summary |---- | 01:47, 17 December 2005 || [[: |
ファイルの使用状況
グローバルなファイル使用状況
以下に挙げる他のウィキがこの画像を使っています:
- es.wikipedia.org での使用状況
- fa.wikipedia.org での使用状況
- hr.wikipedia.org での使用状況
- ko.wikipedia.org での使用状況