ファイル:Younger Dryas-Preboreal boundary on Ngrip 50 dataset.png

元のファイル (1,527 × 797 ピクセル、ファイルサイズ: 310キロバイト、MIME タイプ: image/png)
ウィキメディア・コモンズのファイルページにある説明を、以下に表示します。
|
概要
| 解説 |
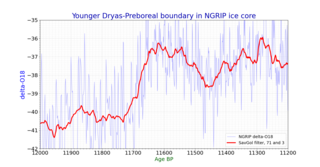
English: This file is GNUPLOT based on subset of NGRIP delta-oxygen data file
Younger Dryas/Preboreal boundary on NGRIP ice core delta-oxygen 18/16 data set ftp://ftp.ncdc.noaa.gov/pub/data/paleo/icecore/greenland/summit/ngrip/isotopes/ngrip-d18o-50yr.txt |
| 日付 | |
| 原典 | 投稿者自身による著作物 |
| 作者 | Merikanto |
Addtitional information
Source of data is
http://www.iceandclimate.nbi.ku.dk/data/ http://www.iceandclimate.nbi.ku.dk/data/NGRIP_d18O_and_dust_5cm.xls
δ18O values and dust concentrations
The dataset provides NGRIP δ18O
values, dust concentrations, and GICC05 ages in 5cm depth resolution for the
period 0-60 ka (δ18O) and 10-60 ka (dust).
The dataset accompany the following papers:
NGRIP members, Nature, 431, 147-151, 2004. DOI: 10.1038/nature02805
Gkinis et al., Earth Planet. Sci. Lett., 405, 132-141, 2014.  DOI:
10.1016/j.epsl.2014.08.022
Ruth et al., J. Geophys. Res., 108, 4098, 2003. DOI: 4010.1029/2002JD002376
- drawing climate diagram in python 3
- version 2.11
- 11.9.2020
-
import matplotlib.pyplot as plt
import numpy as np
import pandas as pd
from scipy import interpolate
from matplotlib.ticker import (MultipleLocator, AutoMinorLocator)
import scipy.signal
def running_mean(x, N):
   cumsum = np.cumsum(np.insert(x, 0, 0))
   return (cumsum[N:] - cumsum[:-N]) / float(N)
datafilename="ngrip1.csv"
captioni="Younger Dryas-Preboreal boundary in NGRIP ice core"
savename="ngrip_dryas.svg"
figsizex=16
figsizey=8
- x = []
- y = []
- y2= []
dfin0=pd.read_csv(datafilename, sep=";")
lst1=['gicc05_age','delta_O18']
dfin1 = dfin0[dfin0.columns.intersection(lst1)]
x0=dfin1['gicc05_age']
y0=dfin1['delta_O18']
- y20=dfin1['GISP_dO18']
- y30=dfin1['GISP2_dO18']
x=np.array(x0)
y=np.array(y0)
- y2=np.array(y20)
- y3=np.array(y30)
- list1=[]
- list1.append(y)
- list1.append(y2)
- list1.append(y3)
- data1=np.array(list1)
- print (np.shape(data1))
- data_avg1=np.average(data1, axis=0)
- print(x)
- print(y)
- quit(0)
size0=14
size1=16
size2=18
size3=24
- y_savgol = scipy.signal.savgol_filter(y,31, 3)
y_savgol = scipy.signal.savgol_filter(y,71, 3)
- y_running = running_mean(y, 31)
x_sm = np.array(x)
y_sm = np.array(y)
x_smooth = np.linspace(x_sm.min(), x_sm.max(), 20000)
funk1 = interpolate.interp1d(x_sm, y_sm, kind="cubic")
y_smooth = funk1(x_smooth)


fig, ax1 = plt.subplots()
- ax1.axis((11600,14000,0,ymax1))
ax1.set_xlim(11200,12000)
- ax1.set_ylim(-30.0, -45.0)
ax1.set_ylim(-35.0, -42.0)


plt.gca().invert_xaxis()
plt.gca().invert_yaxis()
ax1.set_ylabel('delta-O18', color='#0000ff', fontsize=size2+2)


ax1.plot(x,y, color="#a0a0ff", linewidth=1,label="NGRIP delta-O18")
- ax1.plot(x_smooth,y_smooth, color="#0000ff", linewidth=3,label="NGRIP delta-O18")
ax1.plot(x,y_savgol, color="#FF0000", linewidth=3, label="SavGol filter, 71 and 3")
- ax1.plot(x,y_running, color="#FF0000", linewidth=3)
- ax1.plot(x,data_avg1, color="#ff0000", linewidth=2, linestyle=":", label="Average of NGRIP, GISP, GISP2 delta-O18")
ax1.tick_params(axis='both', which='major', labelsize=size2)
ax1.xaxis.set_minor_locator(MultipleLocator(50))
ax1.xaxis.set_minor_locator(MultipleLocator(10))
ax1.yaxis.set_minor_locator(MultipleLocator(1.0))
ax1.yaxis.set_minor_locator(MultipleLocator(0.1))
ax1.grid(which='major', linestyle='-', linewidth='0.1', color='black')
ax1.grid(which='minor', linestyle=':', linewidth='0.1', color='black')


ax1.set_xlabel('Age BP', color="darkgreen", fontsize=size2)


ax1.set_title(captioni, fontsize=size3, color="#0000af")
plt.legend(fontsize=size0)
fig = plt.gcf()
fig.set_size_inches(figsizex, figsizey, forward=True)


plt.savefig(savename, format="svg", dpi = 100)
plt.show()
ライセンス
- あなたは以下の条件に従う場合に限り、自由に
- 共有 – 本作品を複製、頒布、展示、実演できます。
- 再構成 – 二次的著作物を作成できます。
- あなたの従うべき条件は以下の通りです。
- 表示 – あなたは適切なクレジットを表示し、ライセンスへのリンクを提供し、変更があったらその旨を示さなければなりません。これらは合理的であればどのような方法で行っても構いませんが、許諾者があなたやあなたの利用行為を支持していると示唆するような方法は除きます。
- 継承 – もしあなたがこの作品をリミックスしたり、改変したり、加工した場合には、あなたはあなたの貢献部分を元の作品とこれと同一または互換性があるライセンスの下に頒布しなければなりません。
ファイルの履歴
過去の版のファイルを表示するには、その版の日時をクリックしてください。
| 日付と時刻 | サムネイル | 寸法 | 利用者 | コメント | |
|---|---|---|---|---|---|
| 現在の版 | 2020年9月12日 (土) 16:56 | | 1,527 × 797 (310キロバイト) | Merikanto | New data and layout |
| 2013年12月27日 (金) 12:33 |  | 640 × 480 (8キロバイト) | Merikanto~commonswiki | User created page with UploadWizard |
ファイルの使用状況
以下のページがこのファイルを使用しています: