ファイル:2005ICT.PNG

このプレビューのサイズ: 800 × 351 ピクセル。 その他の解像度: 320 × 140 ピクセル | 640 × 281 ピクセル | 1,425 × 625 ピクセル。
元のファイル (1,425 × 625 ピクセル、ファイルサイズ: 59キロバイト、MIME タイプ: image/png)
ウィキメディア・コモンズのファイルページにある説明を、以下に表示します。
|
| 解説 |
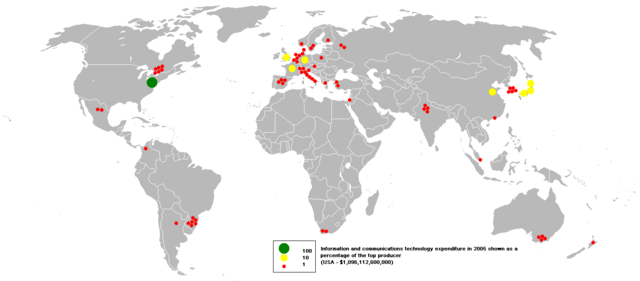
This bubble map shows the global distribution of spending on information and communication technologies in 2005 as a percentage of the top market (USA - $1,096,112,600,000). This map is consistent with incomplete set of data too as long as the top market is known. It resolves the accessibility issues faced by colour-coded maps that may not be properly rendered in old computer screens. Data was extracted on 4th July 2007 from http://siteresources.worldbank.org/DATASTATISTICS/Resources/table5_11.pdf Based on Image:BlankMap-World.png |
||
| 原典 | Originally uploaded at en wiki by User:Anwar saadat under PD-self licence | ||
| 作者 | en:User:Anwar saadat | ||
| 許可 (ファイルの再利用) |
|

|
このeconomic map画像は、ベクターイメージである SVG ファイルとして再作成されるべきです。これにはいくつかの利点があります。詳しくはCommons:Media for cleanupを参照してください。この画像の SVG 形式がすでに利用可能である場合は、アップロードしてください。アップロード後、この画像にあるこのテンプレートを{{Vector version available|新しい画像ファイル名.svg}}テンプレートで置き換えてください。
|
ファイルの履歴
過去の版のファイルを表示するには、その版の日時をクリックしてください。
| 日付と時刻 | サムネイル | 寸法 | 利用者 | コメント | |
|---|---|---|---|---|---|
| 現在の版 | 2007年10月27日 (土) 01:58 | | 1,425 × 625 (59キロバイト) | Shushruth | {{Description=This bubble map shows the global distribution of spending on information and communication technologies in 2005 as a percentage of the top market (USA - $1,096,112,600,000). This map is consistent with incomplete set of data too as long as |
ファイルの使用状況
このファイルを使用しているページはありません。
グローバルなファイル使用状況
以下に挙げる他のウィキがこの画像を使っています:
- an.wikipedia.org での使用状況
- ar.wikipedia.org での使用状況
- as.wikipedia.org での使用状況
- ba.wikipedia.org での使用状況
- be-tarask.wikipedia.org での使用状況
- ca.wikipedia.org での使用状況
- es.wikipedia.org での使用状況
- gl.wikipedia.org での使用状況
- hi.wikipedia.org での使用状況
- id.wikipedia.org での使用状況
- jv.wikipedia.org での使用状況
- ka.wikipedia.org での使用状況
- kk.wikipedia.org での使用状況
- kn.wikipedia.org での使用状況
- la.wikipedia.org での使用状況
- mhr.wikipedia.org での使用状況
- min.wikipedia.org での使用状況
- mk.wikipedia.org での使用状況
- mwl.wikipedia.org での使用状況
- my.wikipedia.org での使用状況
- ro.wikipedia.org での使用状況
- ru.wikipedia.org での使用状況
- si.wikipedia.org での使用状況
- sk.wikipedia.org での使用状況
- so.wikipedia.org での使用状況
- sw.wikipedia.org での使用状況
- tn.wikipedia.org での使用状況
- vi.wikipedia.org での使用状況
- zh.wikipedia.org での使用状況