ファイル:AntarcticBedrock.jpg

このプレビューのサイズ: 600 × 600 ピクセル。 その他の解像度: 240 × 240 ピクセル | 480 × 480 ピクセル | 768 × 768 ピクセル | 1,024 × 1,024 ピクセル | 1,400 × 1,400 ピクセル。
元のファイル (1,400 × 1,400 ピクセル、ファイルサイズ: 509キロバイト、MIME タイプ: image/jpeg)
ウィキメディア・コモンズのファイルページにある説明を、以下に表示します。
|
概要
| 解説 |
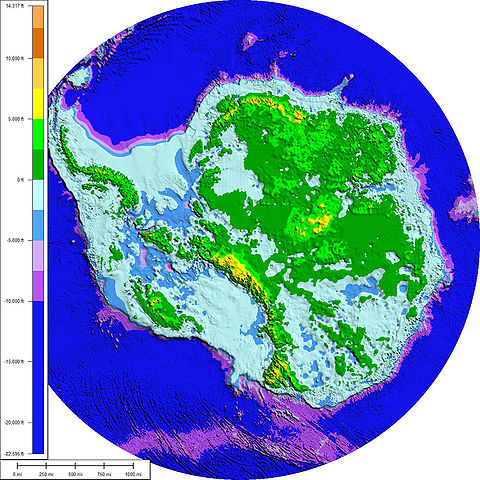
English: The above map shows the subglacial topography and bathymetry of Antarctica. As indicated by the scale on left-hand side, the different shades of blue and purple indicate parts of the ocean floor and sub-ice bedrock, which are below sea level. The other colours indicate Antarctic bedrock lying above sea level. Each colour represents an interval of 2,500 feet in elevation. Map is not corrected for sea level rise or isostatic rebound, which would occur if the Antarctic ice sheet completely melted to expose the bedrock surface. Français : La carte ci-dessus montre la topographie et la bathymétrie sous-glaciaires de l'Antarctique. Comme l'indique l'échelle de gauche, les différentes nuances de bleu et de violet indiquent les parties du fond océanique et du substrat rocheux sous-glaciaire qui sont situées sous le niveau de la mer. Les autres couleurs indiquent les parties du substrat rocheux situées au-dessus du niveau de la mer. Chaque couleur représente un intervalle d'environ 800 mètres (2 500 pieds) d'altitude. La carte n'est pas corrigée de l'élévation du niveau de la mer ou du rebond isostatique qui se produirait si la calotte glaciaire antarctique fondait entièrement, libérant la surface du substrat rocheux. Čeština: Výše uvedená mapa zobrazuje subglaciální topografii a batymetrii Antarktidy. Jak naznačuje měřítko na levé straně, různé odstíny modré a fialové barvy označují části oceánského dna a podledovcového podloží, které se nacházejí pod hladinou moře. Ostatní barvy označují antarktické podloží, které leží nad hladinou moře. Každá barva představuje interval o výšce 2 500 stop (762 m). Mapa není korigována o vzestup mořské hladiny nebo izostatický odraz, ke kterému by došlo, kdyby antarktický ledový příkrov zcela roztál a obnažil povrch skalního podloží. |
| 日付 | |
| 原典 | This map was prepared from BEDMAP gridded data-set for bed-elevation south of 60 degrees S using Global Mapper 7.0.1. The faint rectilinear pattern seen in the shaded relief is an artifact of the gridding of data from linear seismic surveys. The data used to make this map came from "A new ice thickness and subglacial topographic model of the Antarctic" prepared by the BEDMAP Consortium, which is sponsored by the European Ice Sheet Modelling Initiative, Scientific Committee on Antarctic Research. |
| 作者 | Paul V. heinrich |
ライセンス
この作品の著作権者である私は、この作品を以下のライセンスで提供します。
このファイルはクリエイティブ・コモンズ 表示 3.0 非移植ライセンスのもとに利用を許諾されています。
- あなたは以下の条件に従う場合に限り、自由に
- 共有 – 本作品を複製、頒布、展示、実演できます。
- 再構成 – 二次的著作物を作成できます。
- あなたの従うべき条件は以下の通りです。
- 表示 – あなたは適切なクレジットを表示し、ライセンスへのリンクを提供し、変更があったらその旨を示さなければなりません。これらは合理的であればどのような方法で行っても構いませんが、許諾者があなたやあなたの利用行為を支持していると示唆するような方法は除きます。
ファイルの履歴
過去の版のファイルを表示するには、その版の日時をクリックしてください。
| 日付と時刻 | サムネイル | 寸法 | 利用者 | コメント | |
|---|---|---|---|---|---|
| 現在の版 | 2008年8月28日 (木) 04:03 | | 1,400 × 1,400 (509キロバイト) | Cristellaria | == Summary == {{Information |Description=The above map shows the subglacial topography and bathymetry of Antarctica. As indicated by the scale on left-hand side, the different shades of blue and purple indicate parts of the ocean floor and sub-ice bedrock |
| 2008年8月28日 (木) 03:58 |  | 1,400 × 1,400 (509キロバイト) | Cristellaria | {{Information |Description= |Source= |Date= |Author= |Permission= |other_versions= }} | |
| 2008年3月13日 (木) 20:16 |  | 1,400 × 1,400 (515キロバイト) | Cristellaria | {{Information |Description=The above map shows the subglacial topography and bathymetry of Antarctica. As indicated by the scale on left-hand side, the different shades of blue and purple indicate parts of the ocean floor and sub-ice bedrock, which are be |
ファイルの使用状況
以下の 2 ページがこのファイルを使用しています:
グローバルなファイル使用状況
以下に挙げる他のウィキがこの画像を使っています:
- ar.wikipedia.org での使用状況
- ast.wikipedia.org での使用状況
- bn.wikipedia.org での使用状況
- bxr.wikipedia.org での使用状況
- ca.wikipedia.org での使用状況
- cs.wikipedia.org での使用状況
- de.wikipedia.org での使用状況
- el.wikipedia.org での使用状況
- en.wikipedia.org での使用状況
- West Antarctic Ice Sheet
- Portal:Maps/Maps/Geographic
- Tipping points in the climate system
- Portal:Maps/Maps/Geographic/11
- Wikipedia:ITN archives/2009/February
- Wikipedia:Graphics Lab/Map workshop/Archive/Apr 2014
- Wikipedia:Reference desk/Archives/Science/2016 July 19
- User:JPxG/Coolpix
- User:JPxG/!
- User:HN016AQ/sandbox
- es.wikipedia.org での使用状況
- et.wikipedia.org での使用状況
- fr.wikipedia.org での使用状況
- fr.wikinews.org での使用状況
- gl.wikipedia.org での使用状況
- id.wikipedia.org での使用状況
- it.wikipedia.org での使用状況
- ka.wikipedia.org での使用状況
- kn.wikipedia.org での使用状況
- la.wikipedia.org での使用状況
- mk.wikipedia.org での使用状況
- mn.wikipedia.org での使用状況
- nl.wikipedia.org での使用状況
- nn.wikipedia.org での使用状況
- pl.wikipedia.org での使用状況
- pnb.wikipedia.org での使用状況
- pt.wikipedia.org での使用状況
- sl.wikipedia.org での使用状況
- sr.wikipedia.org での使用状況
このファイルのグローバル使用状況を表示する。