ファイル:Beta distribution pdf.svg

この SVG ファイルのこの PNG プレビューのサイズ: 531 × 425 ピクセル. その他の解像度: 300 × 240 ピクセル | 600 × 480 ピクセル | 960 × 768 ピクセル | 1,280 × 1,024 ピクセル | 2,559 × 2,048 ピクセル。
元のファイル (SVG ファイル、531 × 425 ピクセル、ファイルサイズ: 80キロバイト)
ウィキメディア・コモンズのファイルページにある説明を、以下に表示します。
|
概要
| 解説 |
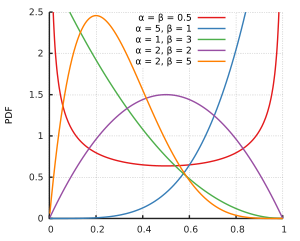
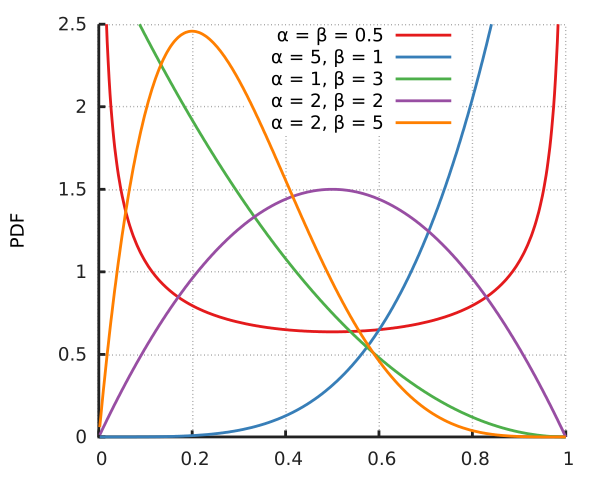
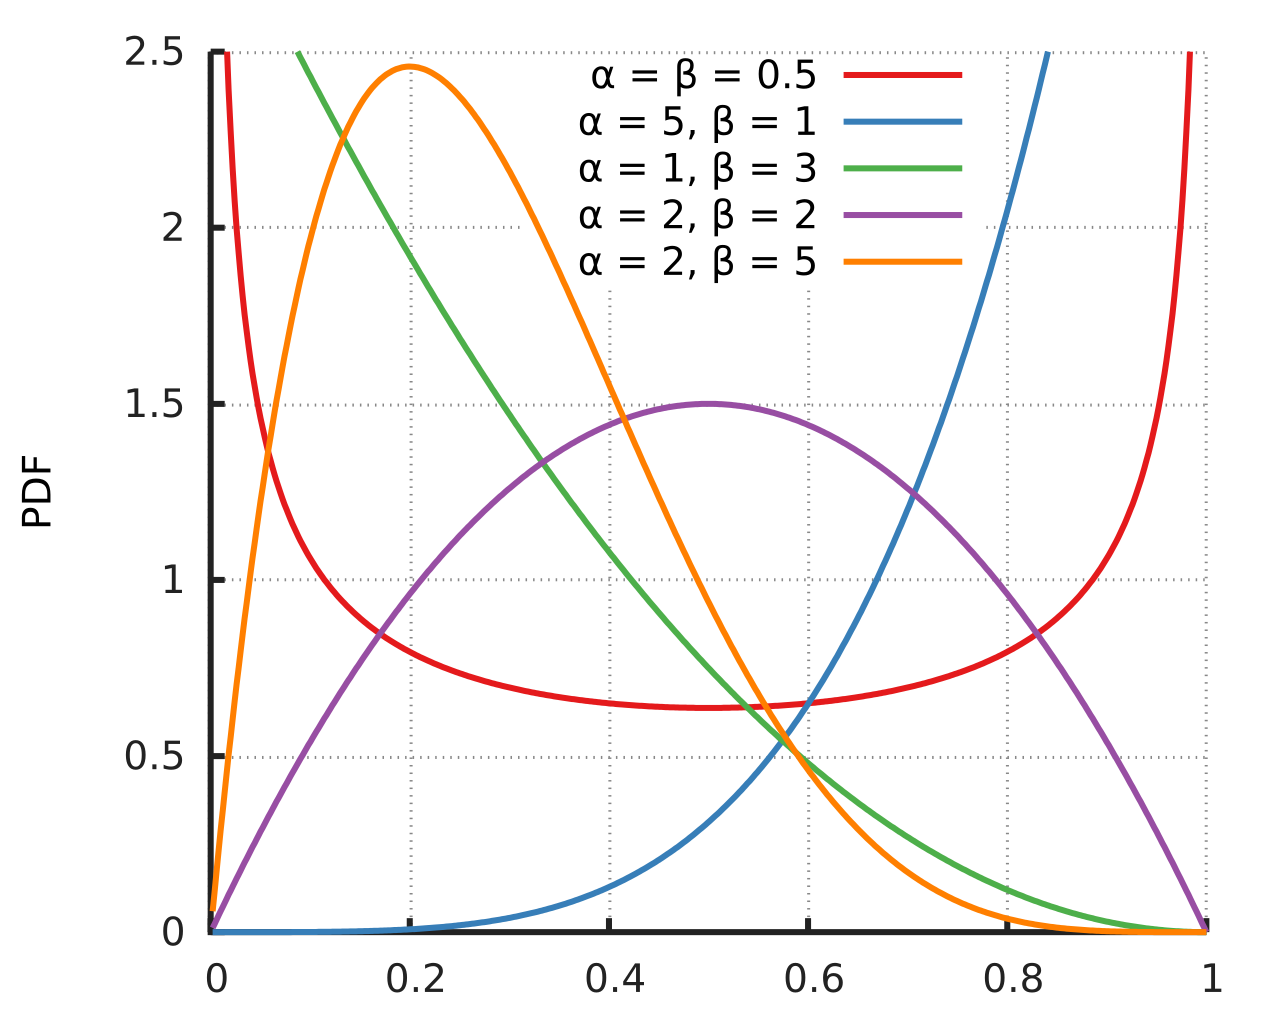
English: Probability density function for the Beta distribution. Created using Gnuplot. |
||||
| 日付 | |||||
| 原典 | 投稿者自身による著作物 | ||||
| 作者 | Horas based on the work of Krishnavedala | ||||
| その他のバージョン | File:Beta_distribution_pdf.png | ||||
| SVG 開発 | |||||
| ソースコード | Gnuplot code
Data
|
ライセンス
| この著作物は、完全に常識的な情報から構成され創作性を欠くために、著作権発生の資格がなく、故にパブリックドメインの状態にあります。 |
ファイルの履歴
過去の版のファイルを表示するには、その版の日時をクリックしてください。
| 日付と時刻 | サムネイル | 寸法 | 利用者 | コメント | |
|---|---|---|---|---|---|
| 現在の版 | 2014年11月14日 (金) 13:10 | | 531 × 425 (80キロバイト) | Horas | {{Information |Description={{en|1=Probability density function for the Beta distribution. Created using the following code: reset reset session out=2 outputpath= "./" outputfilename="betadistribution" if(out==1) {... |
| 2011年6月4日 (土) 21:45 |  | 639 × 489 (68キロバイト) | Krishnavedala | {{Information |Description ={{en|1=Probability density function for the Beta distribution. Created using python with matplotlib, scipy and numpy toolboxes. <syntaxhighlight lang=" |
ファイルの使用状況
以下のページがこのファイルを使用しています:
グローバルなファイル使用状況
以下に挙げる他のウィキがこの画像を使っています:
- be.wikipedia.org での使用状況
- ca.wikipedia.org での使用状況
- de.wikipedia.org での使用状況
- en.wikipedia.org での使用状況
- en.wikibooks.org での使用状況
- en.wiktionary.org での使用状況
- fi.wikipedia.org での使用状況
- he.wikipedia.org での使用状況
- it.wikipedia.org での使用状況
- ko.wikipedia.org での使用状況
- pt.wikipedia.org での使用状況
- tl.wikipedia.org での使用状況
- tr.wikipedia.org での使用状況
- uk.wikipedia.org での使用状況
- zh.wikipedia.org での使用状況