ファイル:CAPspendingbysector.png
高解像度版はありません。
CAPspendingbysector.png (611 × 382 ピクセル、ファイルサイズ: 24キロバイト、MIME タイプ: image/png)
ウィキメディア・コモンズのファイルページにある説明を、以下に表示します。
|

|
このファイルのベクター画像 (SVG) が利用できます。 使う目的に対し、元画像よりもSVGがより優れている場合、SVG画像を使用して下さい。
File:CAPspendingbysector.png → File:CAPspendingbysector.svg
|
 |
en.wikipedia からコモンズに Maksim によって移動されました。
元のファイルページはこちら。以下の利用者は全てen.wikipediaに属します。
概要
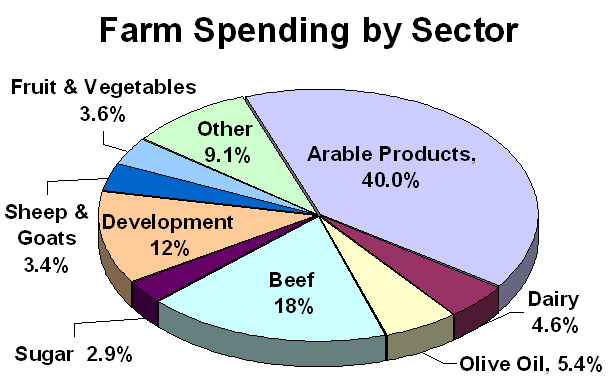
Pie chart showing percentages of CAP expenditure on different agricultural products. Created by me December 2005.
ライセンス
| この著作物は、著作者である英語版ウィキペディアのSandpiperさんによって権利が放棄され、パブリックドメインとされました。これは全世界で適用されます。 一部の国では、これが法的に可能ではない場合があります。その場合は、次のように宣言します。 Sandpiperは、あらゆる人に対して、法により必要とされている条件を除き、如何なる条件も課すことなく、あらゆる目的のためにこの著作物を使用する権利を与えます。 |
| date/time | username | edit summary |
|---|---|---|
| 21:26, 19 December 2005 | en:User:Sandpiper | (Pie chart showing percentages of CAP expenditure on different agricultural products. Created by me December 2005.) |

|
This image shows some kind of simple graph/chart that could be converted to a Wikichart. Storing graphs or charts as images makes it harder to change (correct or translate) them. Wikicharts also help making sure to be consistent in font and size. |
|
| |
元のアップロードログ
Legend: (cur) = this is the current file, (del) = delete this old version, (rev) = revert to this old version.
Click on date to download the file or see the image uploaded on that date.
- (del) (cur) 21:26, 19 December 2005 . . en:User:Sandpiper Sandpiper ( en:User_talk:Sandpiper Talk) . . 611x382 (24190 bytes) (Pie chart showing percentages of CAP expenditure on different agricultural products. Created by me December 2005.)
ファイルの履歴
過去の版のファイルを表示するには、その版の日時をクリックしてください。
| 日付と時刻 | サムネイル | 寸法 | 利用者 | コメント | |
|---|---|---|---|---|---|
| 現在の版 | 2006年4月1日 (土) 07:47 | | 611 × 382 (24キロバイト) | Maksim | La bildo estas kopiita de wikipedia:en. La originala priskribo estas: == Summary == Pie chart showing percentages of CAP expenditure on different agricultural products. Created by me December 2005. == Licensing == {{PD-self}} {| border="1" ! date/time | |
ファイルの使用状況
以下のページがこのファイルを使用しています:
グローバルなファイル使用状況
以下に挙げる他のウィキがこの画像を使っています:
- ca.wikipedia.org での使用状況
- en.wikipedia.org での使用状況
- eo.wikipedia.org での使用状況
- hy.wikipedia.org での使用状況
- ia.wikipedia.org での使用状況
- nl.wikipedia.org での使用状況