ファイル:Ceres Orbit.svg

この SVG ファイルのこの PNG プレビューのサイズ: 742 × 563 ピクセル. その他の解像度: 316 × 240 ピクセル | 633 × 480 ピクセル | 1,012 × 768 ピクセル | 1,280 × 971 ピクセル | 2,560 × 1,942 ピクセル。
元のファイル (SVG ファイル、742 × 563 ピクセル、ファイルサイズ: 21キロバイト)
ウィキメディア・コモンズのファイルページにある説明を、以下に表示します。
|
概要
| 解説 |
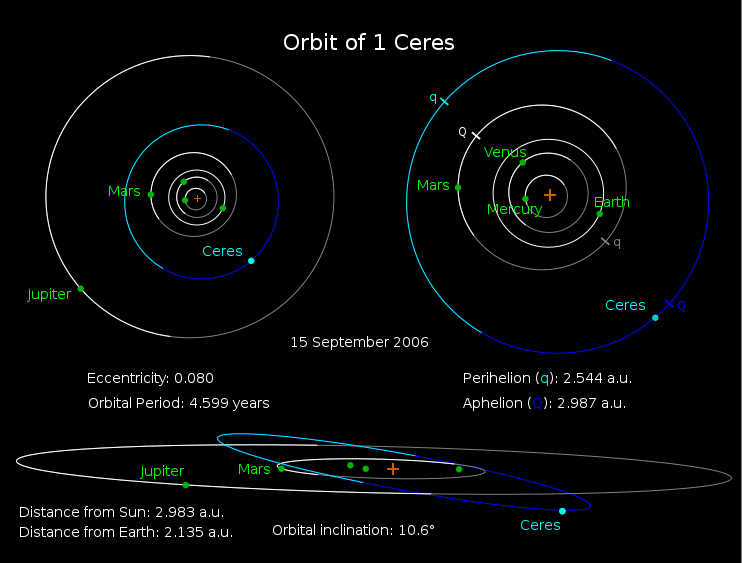
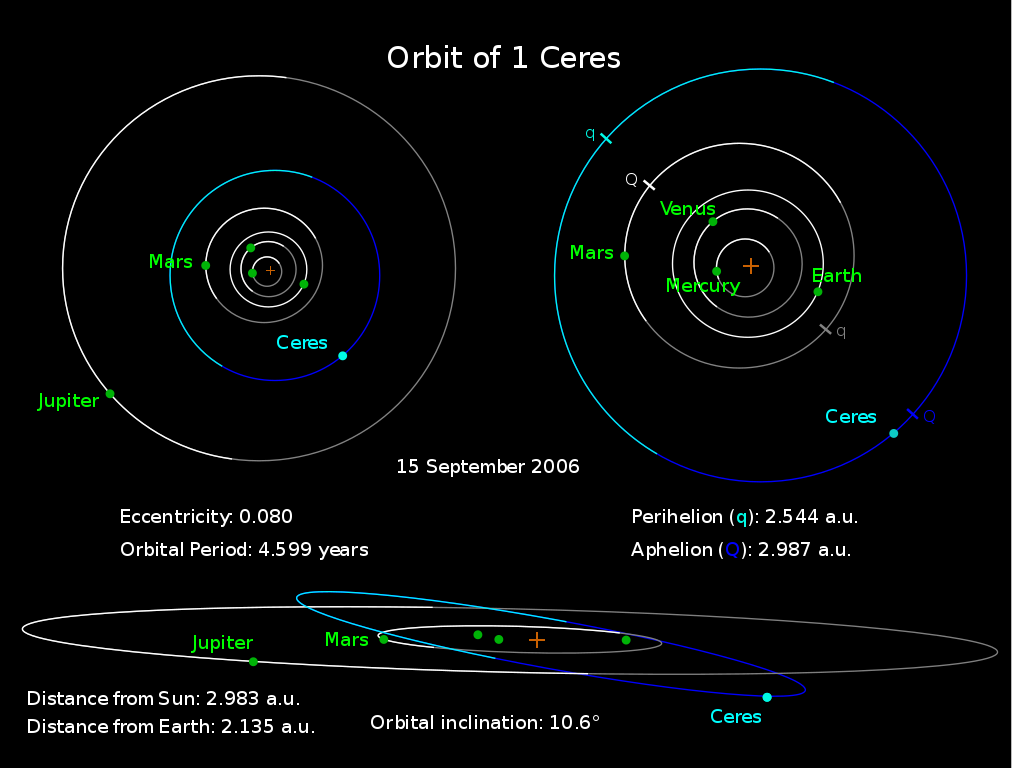
English: The diagram illustrates the orbits of Ceres (blue) and several planets (white/grey). The segments of orbits below the ecliptic are plotted in darker colours, and the orange plus sign is the Sun's location. The top left diagram is a polar view that shows the location of Ceres in the gap between Mars and Jupiter. The top right is a close-up demonstrating the locations of the perihelia (q) and aphelia (Q) of Ceres and Mars. Interestingly, the perihelia of Ceres (as well as those of several other of the largest MBAs) and Mars are on the opposite sides of the Sun. The bottom diagram is a perspective view showing the inclination of the orbit of Ceres compared to the orbits of Mars and Jupiter.
Deutsch: Das Diagramm illustriert die Umlaufbahnen der Ceres (blau) und mehrerer Planeten (weiß/grau). Die Abschnitte der Umlaufbahnen unter der Ekliptik sind in dunkleren Farben dargestellt und die orangenen Plus-Zeichen bezeichnen die Position der Sonne. Das Diagramm links oben ist eine polare Sicht der Periapsis, die die Position der Ceres in der Lücke zwischen Mars und Jupiter zeigt. Das Diagramm rechts oben ist eine Nahaufnahme, die die Positionen der Periapsis (q) und der Apoapsis (Q) der Ceres und des Mars zeigen. Interessanterweise ist die Periapsis der Ceres (wie auch die mehrerer anderer der größten MBAs) und des Mars auf der gegenüberliegenden Seite der Sonne. Das untere Diagramm ist eine perspektivische Sicht, die die Inklination der Umlaufbahn der Ceres mit den Umlaufbahnen des Mars und des Jupiter vergleicht.
Français : Ce schéma montre les orbites de la planète naine (1) Cérès (bleu) et de certaines autres planètes du système solaire (vert et gris). La partie de chaque orbite située sous le plan de l'écliptique est affichée d'une couleur plus sombre ; la croix orange représente la position du Soleil. |
| 日付 | |
| 原典 | Based on data obtained from NASA, here |
| 作者 | User: Orionist |
| その他のバージョン |
|
.svg)


.svg)


|
このSVGファイルには翻訳可能な埋め込みテキストが含まれています。SVG翻訳ツールや他のSVGエディタを使用して自分の言語に翻訳可能です。詳しくはSVGファイルの翻訳についてを参照してください。 |
ライセンス
この作品の著作権者である私は、この作品を以下のライセンスで提供します。

|
この文書は、フリーソフトウェア財団発行のGNUフリー文書利用許諾書 (GNU Free Documentation License) 1.2またはそれ以降のバージョンの規約に基づき、複製や再配布、改変が許可されます。不可変更部分、表紙、背表紙はありません。このライセンスの複製は、GNUフリー文書利用許諾書という章に含まれています。 |
| このファイルはクリエイティブ・コモンズ 表示-継承 3.0 非移植ライセンスのもとに利用を許諾されています。 | ||
| ||
| このライセンスのテンプレートは、GFDLのライセンス・アップデートによりこのファイルに追加されたものです。 |
- あなたは以下の条件に従う場合に限り、自由に
- 共有 – 本作品を複製、頒布、展示、実演できます。
- 再構成 – 二次的著作物を作成できます。
- あなたの従うべき条件は以下の通りです。
- 表示 – あなたは適切なクレジットを表示し、ライセンスへのリンクを提供し、変更があったらその旨を示さなければなりません。これらは合理的であればどのような方法で行っても構いませんが、許諾者があなたやあなたの利用行為を支持していると示唆するような方法は除きます。
- 継承 – もしあなたがこの作品をリミックスしたり、改変したり、加工した場合には、あなたはあなたの貢献部分を元の作品とこれと同一または互換性があるライセンスの下に頒布しなければなりません。
あなたは上記のライセンスから、どれか一つ以上を選択できます。
ファイルの履歴
過去の版のファイルを表示するには、その版の日時をクリックしてください。
| 日付と時刻 | サムネイル | 寸法 | 利用者 | コメント | |
|---|---|---|---|---|---|
| 現在の版 | 2015年3月6日 (金) 18:27 | | 742 × 563 (21キロバイト) | Caesar | Fixed an issue with text that had become outlined ("Perihelion" and "Aphelion"). |
| 2011年9月9日 (金) 16:10 |  | 742 × 563 (50キロバイト) | ANGELUS | fixed | |
| 2009年11月12日 (木) 20:41 |  | 742 × 563 (22キロバイト) | Sebastian Wallroth | text objects transformed | |
| 2006年11月6日 (月) 05:27 |  | 742 × 563 (38キロバイト) | Orionist | {{Information |Description= The diagram illustrates the orbits of Ceres (blue) and several planets (white/grey). The segments of orbits below the ecliptic are plotted in darker colours, and the orange plus sign is the Sun's location. The top left diagram | |
| 2006年11月6日 (月) 04:47 |  | 742 × 563 (38キロバイト) | Orionist | == Summary == {{Information |Description= The diagram illustrates the orbits of Ceres (blue) and several planets (white/grey). The segments of orbits below the ecliptic are plotted in darker colours, and the orange plus sign is the Sun's location. The top |
ファイルの使用状況
以下のページがこのファイルを使用しています:
グローバルなファイル使用状況
以下に挙げる他のウィキがこの画像を使っています:
- ce.wikipedia.org での使用状況
- cs.wikipedia.org での使用状況
- da.wikipedia.org での使用状況
- en.wikipedia.org での使用状況
- en.wikiversity.org での使用状況
- es.wikipedia.org での使用状況
- eu.wikipedia.org での使用状況
- fa.wikipedia.org での使用状況
- fi.wikipedia.org での使用状況
- fr.wikipedia.org での使用状況
- id.wikipedia.org での使用状況
- it.wikipedia.org での使用状況
- ko.wikipedia.org での使用状況
- lfn.wikipedia.org での使用状況
- nl.wikipedia.org での使用状況
- no.wikipedia.org での使用状況
- pl.wikipedia.org での使用状況
- pt.wikipedia.org での使用状況
- ro.wikipedia.org での使用状況
- te.wikipedia.org での使用状況
- tt.wikipedia.org での使用状況
- www.wikidata.org での使用状況
- zh.wikipedia.org での使用状況