ファイル:Crude oil spread.svg

元のファイル (SVG ファイル、825 × 300 ピクセル、ファイルサイズ: 57キロバイト)
ウィキメディア・コモンズのファイルページにある説明を、以下に表示します。
|
概要
| 解説 |
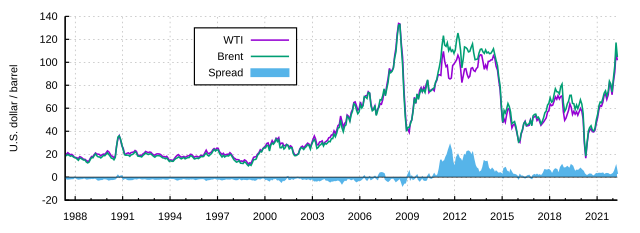
Deutsch: Preisentwicklung der Ölsorten West Texas Intermediate (WTI) und Brent sowie die Entwicklung des Preisunterschiedes („Spread“ = Brent minus WTI) zwischen beiden Sorten, Rohdaten: siehe unten.
English: Price and spread (= Brent minus WTI) histories of the two crude oil types West Texas Intermediate (WTI) and Brent, raw data: see below |
| 日付 | |
| 原典 | 投稿者自身による著作物 |
| 作者 | StefanPohl, updated by Gretarsson |
| SVG 開発 |
ライセンス
| このファイルはクリエイティブ・コモンズ CC0 1.0 全世界 パブリック・ドメイン提供のもとで利用可能にされています。 | |
| ある作品に本コモンズ証を関連づけた者は、その作品について世界全地域において著作権法上認められる、その者が持つすべての権利(その作品に関する権利や隣接する権利を含む。)を、法令上認められる最大限の範囲で放棄して、パブリック・ドメインに提供しています。
この作品は、たとえ営利目的であっても、許可を得ずに複製、改変・翻案、配布、上演・演奏することが出来ます。 |
Code and raw data
#Date	WTI	Brent	Spread
15/05/87	19.44	18.58	-0.86
15/06/87	20.07	18.86	-1.21
15/07/87	21.34	19.86	-1.48
15/08/87	20.31	18.98	-1.33
15/09/87	19.53	18.31	-1.22
15/10/87	19.86	18.76	-1.1
15/11/87	18.85	17.78	-1.07
15/12/87	17.28	17.05	-0.23
15/01/88	17.13	16.75	-0.38
15/02/88	16.8	15.73	-1.07
15/03/88	16.2	14.73	-1.47
15/04/88	17.86	16.6	-1.26
15/05/88	17.42	16.31	-1.11
15/06/88	16.53	15.54	-0.99
15/07/88	15.5	14.91	-0.59
15/08/88	15.52	14.89	-0.63
15/09/88	14.54	13.18	-1.36
15/10/88	13.77	12.41	-1.36
15/11/88	14.14	13.02	-1.12
15/12/88	16.38	15.31	-1.07
15/01/89	18.02	17.17	-0.85
15/02/89	17.94	16.89	-1.05
15/03/89	19.48	18.7	-0.78
15/04/89	21.07	20.32	-0.75
15/05/89	20.12	18.63	-1.49
15/06/89	20.05	17.67	-2.38
15/07/89	19.78	17.62	-2.16
15/08/89	18.58	16.77	-1.81
15/09/89	19.59	17.77	-1.82
15/10/89	20.1	18.91	-1.19
15/11/89	19.86	18.73	-1.13
15/12/89	21.1	19.84	-1.26
15/01/90	22.86	21.25	-1.61
15/02/90	22.11	19.81	-2.3
15/03/90	20.39	18.39	-2
15/04/90	18.43	16.61	-1.82
15/05/90	18.2	16.35	-1.85
15/06/90	16.7	15.1	-1.6
15/07/90	18.45	17.17	-1.28
15/08/90	27.31	27.17	-0.14
15/09/90	33.51	34.9	1.39
15/10/90	36.04	36.02	-0.02
15/11/90	32.33	33.07	0.74
15/12/90	27.28	28.27	0.99
15/01/91	25.23	23.57	-1.66
15/02/91	20.48	19.54	-0.94
15/03/91	19.9	19.08	-0.82
15/04/91	20.83	19.18	-1.65
15/05/91	21.23	19.19	-2.04
15/06/91	20.19	18.17	-2.02
15/07/91	21.4	19.4	-2
15/08/91	21.69	19.77	-1.92
15/09/91	21.89	20.5	-1.39
15/10/91	23.23	22.21	-1.02
15/11/91	22.46	21.11	-1.35
15/12/91	19.5	18.41	-1.09
15/01/92	18.79	18.16	-0.63
15/02/92	19.01	18.05	-0.96
15/03/92	18.92	17.63	-1.29
15/04/92	20.23	18.92	-1.31
15/05/92	20.98	19.89	-1.09
15/06/92	22.39	21.16	-1.23
15/07/92	21.78	20.24	-1.54
15/08/92	21.34	19.74	-1.6
15/09/92	21.88	20.27	-1.61
15/10/92	21.69	20.26	-1.43
15/11/92	20.34	19.21	-1.13
15/12/92	19.41	18.14	-1.27
15/01/93	19.03	17.39	-1.64
15/02/93	20.09	18.47	-1.62
15/03/93	20.32	18.79	-1.53
15/04/93	20.25	18.67	-1.58
15/05/93	19.95	18.51	-1.44
15/06/93	19.09	17.65	-1.44
15/07/93	17.89	16.78	-1.11
15/08/93	18.01	16.7	-1.31
15/09/93	17.5	16.01	-1.49
15/10/93	18.15	16.61	-1.54
15/11/93	16.61	15.2	-1.41
15/12/93	14.52	13.73	-0.79
15/01/94	15.03	14.29	-0.74
15/02/94	14.78	13.8	-0.98
15/03/94	14.68	13.82	-0.86
15/04/94	16.42	15.23	-1.19
15/05/94	17.89	16.19	-1.7
15/06/94	19.06	16.76	-2.3
15/07/94	19.66	17.6	-2.06
15/08/94	18.38	16.89	-1.49
15/09/94	17.45	15.9	-1.55
15/10/94	17.72	16.49	-1.23
15/11/94	18.07	17.19	-0.88
15/12/94	17.16	15.93	-1.23
15/01/95	18.04	16.55	-1.49
15/02/95	18.57	17.11	-1.46
15/03/95	18.54	17.01	-1.53
15/04/95	19.9	18.65	-1.25
15/05/95	19.74	18.35	-1.39
15/06/95	18.45	17.31	-1.14
15/07/95	17.33	15.85	-1.48
15/08/95	18.02	16.1	-1.92
15/09/95	18.23	16.7	-1.53
15/10/95	17.43	16.11	-1.32
15/11/95	17.99	16.86	-1.13
15/12/95	19.03	17.93	-1.1
15/01/96	18.86	17.85	-1.01
15/02/96	19.09	18	-1.09
15/03/96	21.33	19.85	-1.48
15/04/96	23.5	20.9	-2.6
15/05/96	21.17	19.15	-2.02
15/06/96	20.42	18.46	-1.96
15/07/96	21.3	19.57	-1.73
15/08/96	21.9	20.51	-1.39
15/09/96	23.97	22.63	-1.34
15/10/96	24.88	24.16	-0.72
15/11/96	23.71	22.76	-0.95
15/12/96	25.23	23.78	-1.45
15/01/97	25.13	23.54	-1.59
15/02/97	22.18	20.85	-1.33
15/03/97	20.97	19.13	-1.84
15/04/97	19.7	17.56	-2.14
15/05/97	20.82	19.02	-1.8
15/06/97	19.26	17.58	-1.68
15/07/97	19.66	18.46	-1.2
15/08/97	19.95	18.6	-1.35
15/09/97	19.8	18.46	-1.34
15/10/97	21.33	19.87	-1.46
15/11/97	20.19	19.17	-1.02
15/12/97	18.33	17.18	-1.15
15/01/98	16.72	15.19	-1.53
15/02/98	16.06	14.07	-1.99
15/03/98	15.12	13.1	-2.02
15/04/98	15.35	13.53	-1.82
15/05/98	14.91	14.36	-0.55
15/06/98	13.72	12.21	-1.51
15/07/98	14.17	12.08	-2.09
15/08/98	13.47	11.91	-1.56
15/09/98	15.03	13.34	-1.69
15/10/98	14.46	12.7	-1.76
15/11/98	13	11.04	-1.96
15/12/98	11.35	9.82	-1.53
15/01/99	12.52	11.11	-1.41
15/02/99	12.01	10.27	-1.74
15/03/99	14.68	12.51	-2.17
15/04/99	17.31	15.29	-2.02
15/05/99	17.72	15.23	-2.49
15/06/99	17.92	15.86	-2.06
15/07/99	20.1	19.08	-1.02
15/08/99	21.28	20.22	-1.06
15/09/99	23.8	22.54	-1.26
15/10/99	22.69	22	-0.69
15/11/99	25	24.58	-0.42
15/12/99	26.1	25.47	-0.63
15/01/00	27.26	25.51	-1.75
15/02/00	29.37	27.78	-1.59
15/03/00	29.84	27.49	-2.35
15/04/00	25.72	22.76	-2.96
15/05/00	28.79	27.74	-1.05
15/06/00	31.82	29.8	-2.02
15/07/00	29.7	28.68	-1.02
15/08/00	31.26	30.2	-1.06
15/09/00	33.88	33.14	-0.74
15/10/00	33.11	30.96	-2.15
15/11/00	34.42	32.55	-1.87
15/12/00	28.44	25.66	-2.78
15/01/01	29.59	25.62	-3.97
15/02/01	29.61	27.5	-2.11
15/03/01	27.25	24.5	-2.75
15/04/01	27.49	25.66	-1.83
15/05/01	28.63	28.31	-0.32
15/06/01	27.6	27.85	0.25
15/07/01	26.43	24.61	-1.82
15/08/01	27.37	25.68	-1.69
15/09/01	26.2	25.62	-0.58
15/10/01	22.17	20.54	-1.63
15/11/01	19.64	18.8	-0.84
15/12/01	19.39	18.71	-0.68
15/01/02	19.72	19.42	-0.3
15/02/02	20.72	20.28	-0.44
15/03/02	24.53	23.7	-0.83
15/04/02	26.18	25.73	-0.45
15/05/02	27.04	25.35	-1.69
15/06/02	25.52	24.08	-1.44
15/07/02	26.97	25.74	-1.23
15/08/02	28.39	26.65	-1.74
15/09/02	29.66	28.4	-1.26
15/10/02	28.84	27.54	-1.3
15/11/02	26.35	24.34	-2.01
15/12/02	29.46	28.33	-1.13
15/01/03	32.95	31.18	-1.77
15/02/03	35.83	32.77	-3.06
15/03/03	33.51	30.61	-2.9
15/04/03	28.17	25	-3.17
15/05/03	28.11	25.86	-2.25
15/06/03	30.66	27.65	-3.01
15/07/03	30.76	28.35	-2.41
15/08/03	31.57	29.89	-1.68
15/09/03	28.31	27.11	-1.2
15/10/03	30.34	29.61	-0.73
15/11/03	31.11	28.75	-2.36
15/12/03	32.13	29.81	-2.32
15/01/04	34.31	31.28	-3.03
15/02/04	34.69	30.86	-3.83
15/03/04	36.74	33.63	-3.11
15/04/04	36.75	33.59	-3.16
15/05/04	40.28	37.57	-2.71
15/06/04	38.03	35.18	-2.85
15/07/04	40.78	38.22	-2.56
15/08/04	44.9	42.74	-2.16
15/09/04	45.94	43.2	-2.74
15/10/04	53.28	49.78	-3.5
15/11/04	48.47	43.11	-5.36
15/12/04	43.15	39.6	-3.55
15/01/05	46.84	44.51	-2.33
15/02/05	48.15	45.48	-2.67
15/03/05	54.19	53.1	-1.09
15/04/05	52.98	51.88	-1.1
15/05/05	49.83	48.65	-1.18
15/06/05	56.35	54.35	-2
15/07/05	59	57.52	-1.48
15/08/05	64.99	63.98	-1.01
15/09/05	65.59	62.91	-2.68
15/10/05	62.26	58.54	-3.72
15/11/05	58.32	55.24	-3.08
15/12/05	59.41	56.86	-2.55
15/01/06	65.49	62.99	-2.5
15/02/06	61.63	60.21	-1.42
15/03/06	62.69	62.06	-0.63
15/04/06	69.44	70.26	0.82
15/05/06	70.84	69.78	-1.06
15/06/06	70.95	68.56	-2.39
15/07/06	74.41	73.67	-0.74
15/08/06	73.04	73.23	0.19
15/09/06	63.8	61.96	-1.84
15/10/06	58.89	57.81	-1.08
15/11/06	59.08	58.76	-0.32
15/12/06	61.96	62.47	0.51
15/01/07	54.51	53.68	-0.83
15/02/07	59.28	57.56	-1.72
15/03/07	60.44	62.05	1.61
15/04/07	63.98	67.49	3.51
15/05/07	63.46	67.21	3.75
15/06/07	67.49	71.05	3.56
15/07/07	74.12	76.93	2.81
15/08/07	72.36	70.76	-1.6
15/09/07	79.92	77.17	-2.75
15/10/07	85.8	82.34	-3.46
15/11/07	94.77	92.41	-2.36
15/12/07	91.69	90.93	-0.76
15/01/08	92.97	92.18	-0.79
15/02/08	95.39	94.99	-0.4
15/03/08	105.45	103.64	-1.81
15/04/08	112.58	109.07	-3.51
15/05/08	125.4	122.8	-2.6
15/06/08	133.88	132.32	-1.56
15/07/08	133.37	132.72	-0.65
15/08/08	116.67	113.24	-3.43
15/09/08	104.11	97.23	-6.88
15/10/08	76.61	71.58	-5.03
15/11/08	57.31	52.45	-4.86
15/12/08	41.12	39.95	-1.17
15/01/09	41.71	43.44	1.73
15/02/09	39.09	43.32	4.23
15/03/09	47.94	46.54	-1.4
15/04/09	49.65	50.18	0.53
15/05/09	59.03	57.3	-1.73
15/06/09	69.64	68.61	-1.03
15/07/09	64.15	64.44	0.29
15/08/09	71.05	72.51	1.46
15/09/09	69.41	67.65	-1.76
15/10/09	75.72	72.77	-2.95
15/11/09	77.99	76.66	-1.33
15/12/09	74.47	74.46	-0.01
15/01/10	78.33	76.17	-2.16
15/02/10	76.39	73.75	-2.64
15/03/10	81.2	78.83	-2.37
15/04/10	84.29	84.82	0.53
15/05/10	73.74	75.95	2.21
15/06/10	75.34	74.76	-0.58
15/07/10	76.32	75.58	-0.74
15/08/10	76.6	77.04	0.44
15/09/10	75.24	77.84	2.6
15/10/10	81.89	82.67	0.78
15/11/10	84.25	85.28	1.03
15/12/10	89.15	91.45	2.3
15/01/11	89.17	96.52	7.35
15/02/11	88.58	103.72	15.14
15/03/11	102.86	114.64	11.78
15/04/11	109.53	123.26	13.73
15/05/11	100.9	114.99	14.09
15/06/11	96.26	113.83	17.57
15/07/11	97.3	116.97	19.67
15/08/11	86.33	110.22	23.89
15/09/11	85.52	112.83	27.31
15/10/11	86.32	109.55	23.23
15/11/11	97.16	110.77	13.61
15/12/11	98.56	107.87	9.31
15/01/12	100.27	110.69	10.42
15/02/12	102.2	119.33	17.13
15/03/12	106.16	125.45	19.29
15/04/12	103.32	119.75	16.43
15/05/12	94.66	110.34	15.68
15/06/12	82.3	95.16	12.86
15/07/12	87.9	102.62	14.72
15/08/12	94.13	113.36	19.23
15/09/12	94.51	112.86	18.35
15/10/12	89.49	111.71	22.22
15/11/12	86.53	109.06	22.53
15/12/12	87.86	109.49	21.63
15/01/13	94.76	112.96	18.2
15/02/13	95.31	116.05	20.74
15/03/13	92.94	108.47	15.53
15/04/13	92.02	102.25	10.23
15/05/13	94.51	102.56	8.05
15/06/13	95.77	102.92	7.15
15/07/13	104.67	107.93	3.26
15/08/13	106.57	111.28	4.71
15/09/13	106.29	111.6	5.31
15/10/13	100.54	109.08	8.54
15/11/13	93.86	107.79	13.93
15/12/13	97.63	110.76	13.13
15/01/14	94.62	108.12	13.5
15/02/14	100.82	108.9	8.08
15/03/14	100.8	107.48	6.68
15/04/14	102.07	107.76	5.69
15/05/14	102.18	109.54	7.36
15/06/14	105.79	111.8	6.01
15/07/14	103.59	106.77	3.18
15/08/14	96.54	101.61	5.07
15/09/14	93.21	97.09	3.88
15/10/14	84.4	87.43	3.03
15/11/14	75.79	79.44	3.65
15/12/14	59.29	62.34	3.05
15/01/15	47.22	47.76	0.54
15/02/15	50.58	58.1	7.52
15/03/15	47.82	55.89	8.07
15/04/15	54.45	59.52	5.07
15/05/15	59.27	64.08	4.81
15/06/15	59.82	61.48	1.66
15/07/15	50.9	56.56	5.66
15/08/15	42.87	46.52	3.65
15/09/15	45.48	47.62	2.14
15/10/15	46.22	48.43	2.21
15/11/15	42.44	44.27	1.83
15/12/15	37.19	38.01	0.82
15/01/16	31.68	30.7	-0.98
15/02/16	30.32	32.18	1.86
15/03/16	37.55	38.21	0.66
15/04/16	40.75	41.58	0.83
15/05/16	46.71	46.74	0.03
15/06/16	48.76	48.25	-0.51
15/07/16	44.65	44.95	0.3
15/08/16	44.72	45.84	1.12
15/09/16	45.18	46.57	1.39
15/10/16	49.78	49.52	-0.26
15/11/16	45.66	44.73	-0.93
15/12/16	51.97	53.31	1.34
15/01/17	52.5	54.58	2.08
15/02/17	53.47	54.87	1.4
15/03/17	49.33	51.59	2.26
15/04/17	51.06	52.31	1.25
15/05/17	48.48	50.33	1.85
15/06/17	45.18	46.37	1.19
15/07/17	46.63	48.48	1.85
15/08/17	48.04	51.7	3.66
15/09/17	49.82	56.15	6.33
15/10/17	51.58	57.51	5.93
15/11/17	56.64	62.71	6.07
15/12/17	57.88	64.37	6.49
15/01/18	63.7	69.08	5.38
15/02/18	62.23	65.32	3.09
15/03/18	62.73	66.02	3.29
15/04/18	66.25	72.11	5.86
15/05/18	69.98	76.98	7
15/06/18	67.87	74.41	6.54
15/07/18	70.98	74.25	3.27
15/08/18	68.06	72.53	4.47
15/09/18	70.23	78.89	8.66
15/10/18	70.75	81.03	10.28
15/11/18	56.96	64.75	7.79
15/12/18	49.52	57.36	7.84
15/01/19	51.38	59.41	8.03
15/02/19	54.95	63.96	9.01
15/03/19	58.15	66.14	7.99
15/04/19	63.86	71.23	7.37
15/05/19	60.83	71.32	10.49
15/06/19	54.66	64.22	9.56
15/07/19	57.35	63.92	6.57
15/08/19	54.81	59.04	4.23
15/09/19	56.95	62.83	5.88
15/10/19	53.96	59.71	5.75
15/11/19	57.03	63.21	6.18
15/12/19	59.88	67.31	7.43
15/01/20	57.52	63.65	6.13
15/02/20	50.54	55.66	5.12
15/03/20	29.21	32.01	2.8
15/04/20	16.55	18.38	1.83
15/05/20	28.56	29.38	0.82
15/06/20	38.31	40.27	1.96
15/07/20	40.71	43.24	2.53
15/08/20	42.34	44.74	2.4
15/09/20	39.63	40.91	1.28
15/10/20	39.4	40.19	0.79
15/11/20	40.94	42.69	1.75
15/12/20	47.02	49.99	2.97
15/01/21	52	54.77	2.77
15/02/21	59.04	62.28	3.24
15/03/21	62.33	65.41	3.08
15/04/21	61.72	64.81	3.09
15/05/21	65.17	68.53	3.36
15/06/21	71.38	73.16	1.78
15/07/21	72.49	75.17	2.68
15/08/21	67.73	70.75	3.02
15/09/21	71.65	74.49	2.84
15/10/21	81.48	83.54	2.06
15/11/21	79.15	81.05	1.9
15/12/21	71.71	74.17	2.46
15/01/22	83.22	86.51	3.29
15/02/22	91.64	97.13	5.49
15/03/22	108.5	117.25	8.75
15/04/22	101.78	104.58	2.8
set xdata time
set xrange ["15/05/87":"15/04/22"]
set format x "%Y"
set yrange [-20:140]
set ylabel "U.S. dollar / barrel"
set border 3 lw 1.5
set tics nomirror scale 0.5
set key at "01/01/02",130 box lw 1.5 width 0.5 height 0.5
set grid
set terminal svg size 825,300 font "Arial, 14"
set output "Crude oil spread.svg"
plot  "WTI_brent_spread.txt" u 1:2 w l lw 2 t "WTI",  "WTI_brent_spread.txt" u 1:3 w l lw 2 t "Brent",  "WTI_brent_spread.txt" u 1:4:(0) w filledcurve t "Spread",  "WTI_brent_spread.txt" u 1:4 w l lc rgb "#56B4E9" lw 2 notitle, 0 lc rgb "#66000000" lw 1.5 notitle
Der Befehlscode kann ohne weiteres in die Zwischenablage kopiert und in das Kommandozeilen-Fenster von Gnuplot eingefügt werden. Die Datei wird erstellt, indem nach dem Einfügen die ENTER-Taste betätigt wird (es sei denn, unterhalb der eingefügten Sequenz befindet sich ein Prompt -- in diesem Fall wurde der Code bereits ausgeführt und die Datei ist bereits erstellt worden!). Damit alles funktioniert, muss die .txt-Datei, die die Rohdaten enthält, WTI_brent_spread.txt genannt werden und im gleichen Verzeichnis liegen wie die gnuplot.exe (d.h. im bin-Ordner des Gnuplot-Installationsverzeichnisses). Die Crude oil spread.svg wird im gleichen Verzeichnis abgelegt werden (und wenn nicht dort, dann im Benutzer-Ordner Dokumente).
The command code can be copied to the clipboard and pasted into Gnuplot’s command line shell window. The file is created by pressing ENTER after pasting (unless there appears a prompt after the pasted sequence -- in this case the code has already been run!). In order to make it work properly the .txt file containing the raw data (see above) has to be named WTI_brent_spread.txt and has to be located in the same directory as the gnuplot.exe (i.e. the bin folder of the Gnuplot install directory). The Crude oil spread.svg will be saved in the same directory (and if not it might have been saved to the user’s folder Documents).
ファイルの履歴
過去の版のファイルを表示するには、その版の日時をクリックしてください。
| 日付と時刻 | サムネイル | 寸法 | 利用者 | コメント | |
|---|---|---|---|---|---|
| 現在の版 | 2022年5月31日 (火) 02:22 | 825 × 300 (57キロバイト) | Gretarsson | Update | |
| 2018年3月25日 (日) 01:43 | 825 × 300 (53キロバイト) | Gretarsson | ‘smoothened’ area graph (“spread”) by superimposing a line graph of same color on it and decreased ticmark size by 50 %, both in order to make the diagram look more similar in style to its first version | ||
| 2018年3月6日 (火) 17:27 | 825 × 300 (48キロバイト) | Gretarsson | used decimal period in the datafile instead of comma -> more precise curves (sorry for such a beginner's mistake); some minor cosmetic changes | ||
| 2018年3月5日 (月) 20:37 | 825 × 300 (51キロバイト) | Gretarsson | update (end date Jan 2018) | ||
| 2016年8月6日 (土) 20:43 | 800 × 300 (45キロバイト) | StefanInaktiv | User created page with UploadWizard |
ファイルの使用状況
以下のページがこのファイルを使用しています:
グローバルなファイル使用状況
以下に挙げる他のウィキがこの画像を使っています:
- af.wikipedia.org での使用状況
- de.wikipedia.org での使用状況
- en.wikipedia.org での使用状況
- es.wikipedia.org での使用状況
- eu.wikipedia.org での使用状況
- fa.wikipedia.org での使用状況
- ko.wikipedia.org での使用状況
- pt.wikipedia.org での使用状況
- simple.wikipedia.org での使用状況
- sv.wikipedia.org での使用状況
- uk.wikipedia.org での使用状況
- vi.wikipedia.org での使用状況