ファイル:Gdp-and-labour-force-by-sector.png
このプレビューのサイズ: 680 × 599 ピクセル。 その他の解像度: 272 × 240 ピクセル | 545 × 480 ピクセル | 871 × 768 ピクセル | 1,162 × 1,024 ピクセル | 1,425 × 1,256 ピクセル。
元のファイル (1,425 × 1,256 ピクセル、ファイルサイズ: 116キロバイト、MIME タイプ: image/png)
ウィキメディア・コモンズのファイルページにある説明を、以下に表示します。
|
概要
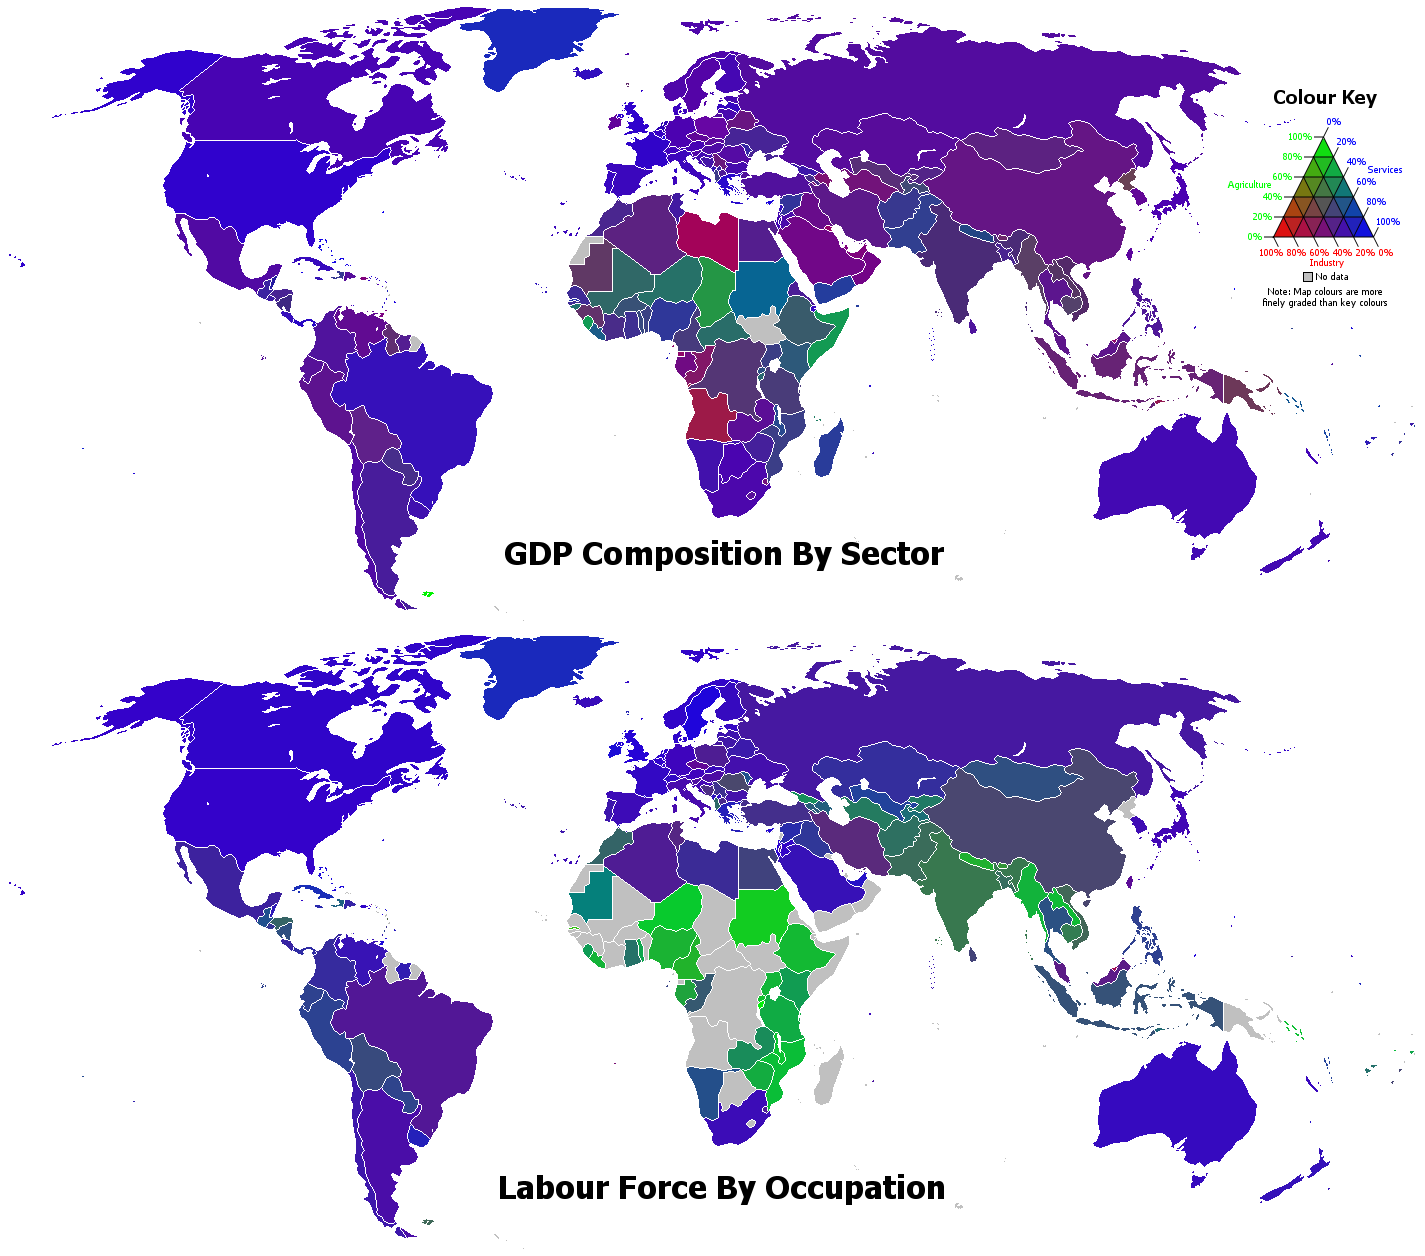
| 解説 | GDP Composition By Sector and Labour Force By Occupation, produced using data from the CIA World Factbook 2006. The green, red, and blue components of the colors of the countries represent the percentages for the agriculture, industry, and services sectors respectively, as summarized on the color key - for example, rgb(102,51,201) represents 20% agriculture, 40% industry, and 40% services. |
| 日付 | UTC |
| 原典 | 投稿者自身による著作物 |
| 作者 | Safalra (Stephen Morley) |
ライセンス
| この著作物の著作権者である私は、この著作物における権利を放棄しパブリックドメインとします。これは全世界で適用されます。 一部の国では、これが法的に可能ではない場合があります。その場合は、次のように宣言します。 私は、あらゆる人に対して、法により必要とされている条件を除き、如何なる条件も課すことなく、あらゆる目的のためにこの著作物を使用する権利を与えます。 |
ファイルの履歴
過去の版のファイルを表示するには、その版の日時をクリックしてください。
| 日付と時刻 | サムネイル | 寸法 | 利用者 | コメント | |
|---|---|---|---|---|---|
| 現在の版 | 2018年10月30日 (火) 02:21 | | 1,425 × 1,256 (116キロバイト) | Ketrit | Minor fixes |
| 2018年10月30日 (火) 01:38 |  | 1,425 × 1,256 (116キロバイト) | Ketrit | Updated for 2018. | |
| 2006年9月18日 (月) 15:27 |  | 1,357 × 1,256 (90キロバイト) | Safalra | {{Information |Description = GDP Composition By Sector and Labour Force By Occupation, produced using data from the CIA World Factbook 2006. The green, red, and blue components of the colours of the countries represent the percentages for the agriculture, | |
| 2006年9月18日 (月) 15:21 |  | 1,357 × 1,256 (90キロバイト) | Safalra | == Summary == {{Information |Description = GDP Composition By Sector and Labour Force By Occupation, produced using data from the CIA World Factbook 2006. The green, red, and blue components of the colours of the countries represent the percentages for th |
ファイルの使用状況
以下のページがこのファイルを使用しています:
グローバルなファイル使用状況
以下に挙げる他のウィキがこの画像を使っています:
- ar.wikipedia.org での使用状況
- br.wikipedia.org での使用状況
- ca.wikipedia.org での使用状況
- ceb.wikipedia.org での使用状況
- ckb.wikipedia.org での使用状況
- co.wikipedia.org での使用状況
- crh.wikipedia.org での使用状況
- cs.wikipedia.org での使用状況
- da.wikipedia.org での使用状況
- el.wikipedia.org での使用状況
- en.wikipedia.org での使用状況
- fa.wikipedia.org での使用状況
- fr.wikipedia.org での使用状況
- hi.wikipedia.org での使用状況
- hu.wikipedia.org での使用状況
- hy.wikipedia.org での使用状況
- it.wikipedia.org での使用状況
- it.wikibooks.org での使用状況
- kk.wikipedia.org での使用状況
- ko.wikipedia.org での使用状況
- lez.wikipedia.org での使用状況
- lo.wikipedia.org での使用状況
- lt.wikipedia.org での使用状況
- mk.wikipedia.org での使用状況
- ml.wikipedia.org での使用状況
- my.wikipedia.org での使用状況
- ne.wikipedia.org での使用状況
- new.wikipedia.org での使用状況
- pa.wikipedia.org での使用状況
- ps.wikipedia.org での使用状況
- pt.wikipedia.org での使用状況
- ru.wikipedia.org での使用状況
- sl.wikipedia.org での使用状況
- sr.wikipedia.org での使用状況
- sr.wikiquote.org での使用状況
- te.wikipedia.org での使用状況
- tr.wikipedia.org での使用状況
- tt.wikipedia.org での使用状況
- uk.wikipedia.org での使用状況
- vec.wikipedia.org での使用状況
- vi.wikipedia.org での使用状況
- www.wikidata.org での使用状況
- zh-min-nan.wikipedia.org での使用状況
- zh.wikipedia.org での使用状況