ファイル:MER Star Plot.gif
MER_Star_Plot.gif (560 × 438 ピクセル、ファイルサイズ: 28キロバイト、MIME タイプ: image/gif)
ファイルの履歴
過去の版のファイルを表示するには、その版の日時をクリックしてください。
| 日付と時刻 | サムネイル | 寸法 | 利用者 | コメント | |
|---|---|---|---|---|---|
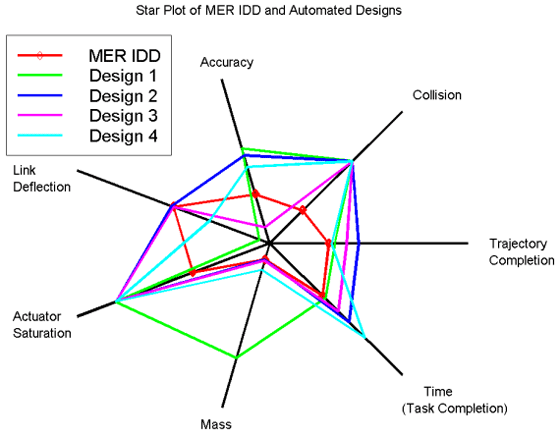
| 現在の版 | 2008年10月14日 (火) 22:51 |  | 560 × 438 (28キロバイト) | Mdd | {{Information |Description={{en|1=In this star plot, the center represents the most desirable results. The red line represents the handcrafted MER IDD, and is used for comparison and validation of the approach. This graph illustrates the fact that improv |
ファイルの使用状況
グローバルなファイル使用状況
以下に挙げる他のウィキがこの画像を使っています:
- en.wikipedia.org での使用状況
- en.wikiversity.org での使用状況
- et.wikipedia.org での使用状況
- eu.wikipedia.org での使用状況
- fa.wikipedia.org での使用状況
- hu.wikipedia.org での使用状況
- it.wikipedia.org での使用状況
- no.wikipedia.org での使用状況
- pt.wikipedia.org での使用状況
- ru.wikipedia.org での使用状況
- uk.wikipedia.org での使用状況


