ファイル:U.S. Home Ownership and Subprime Origination Share.png

元のファイル (960 × 720 ピクセル、ファイルサイズ: 29キロバイト、MIME タイプ: image/png)
ウィキメディア・コモンズのファイルページにある説明を、以下に表示します。
|
概要

|
このグラフ画像は、ベクターイメージである SVG ファイルとして再作成されるべきです。これにはいくつかの利点があります。詳しくはCommons:Media for cleanupを参照してください。この画像の SVG 形式がすでに利用可能である場合は、アップロードしてください。アップロード後、この画像にあるこのテンプレートを{{Vector version available|新しい画像ファイル名.svg}}テンプレートで置き換えてください。
|
| 解説 |
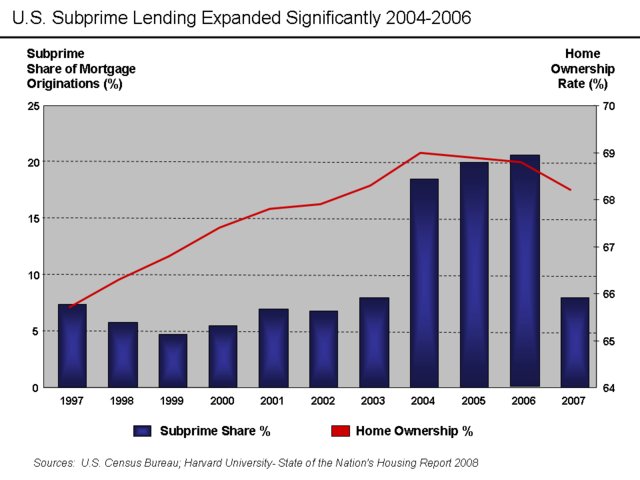
English: There are various mortgage categories defined based on the credit quality of the borrower. These include subprime, Alt-A, and Prime. The share of subprime mortgages is shown in the diagram. It is the ratio of the dollar value of subprime mortgages to all originations, expressed as a percentage. The level of home ownership is based on the percentage of American households that own homes rather than rent.
Subprime mortgages remained below 10% of all mortgage originations until 2004, when they spiked to nearly 20% and remained there through the 2005-2006 peak of the housing bubble.[1] A proximate event to this increase was the April 2004 decision by the SEC to relax the net capital rule, which encouraged the largest five investment banks to dramatically increase their financial leverage and aggressively expand their issuance of mortgage-backed securities. This applied additional competitive pressure to Fannie Mae and Freddie Mac, which further expanded their riskier lending.[2] Excerpts from the Harvard Report:
Other interpretations:
Source Data |
| 日付 | 2009年5月30日 (当初のアップロード日) |
| 原典 | en.wikipedia からコモンズに移動されました。 |
| 作者 | 英語版ウィキペディアのFarcasterさん |
ライセンス
- あなたは以下の条件に従う場合に限り、自由に
- 共有 – 本作品を複製、頒布、展示、実演できます。
- 再構成 – 二次的著作物を作成できます。
- あなたの従うべき条件は以下の通りです。
- 表示 – あなたは適切なクレジットを表示し、ライセンスへのリンクを提供し、変更があったらその旨を示さなければなりません。これらは合理的であればどのような方法で行っても構いませんが、許諾者があなたやあなたの利用行為を支持していると示唆するような方法は除きます。
- 継承 – もしあなたがこの作品をリミックスしたり、改変したり、加工した場合には、あなたはあなたの貢献部分を元の作品とこれと同一または互換性があるライセンスの下に頒布しなければなりません。

|
この文書は、フリーソフトウェア財団発行のGNUフリー文書利用許諾書 (GNU Free Documentation License) 1.2またはそれ以降のバージョンの規約に基づき、複製や再配布、改変が許可されます。不可変更部分、表紙、背表紙はありません。このライセンスの複製は、GNUフリー文書利用許諾書という章に含まれています。 |
元のアップロードログ
- 2009-05-30 23:44 Farcaster 960×720× (30085 bytes)
- 2009-05-30 23:16 Farcaster 960×720× (28829 bytes) {{Information |Description = Subprime mortgage share as % originations and home ownership rate |Source = [http://www.jchs.harvard.edu/publications/markets/son2008/son2008.pdf Harvard 2008 State of Nation's Housing Report] |Date = M
ファイルの履歴
過去の版のファイルを表示するには、その版の日時をクリックしてください。
| 日付と時刻 | サムネイル | 寸法 | 利用者 | コメント | |
|---|---|---|---|---|---|
| 現在の版 | 2010年10月14日 (木) 00:57 | | 960 × 720 (29キロバイト) | Hideokun | {{Information |Description={{en|There are various mortgage categories defined based on the credit quality of the borrower. These include subprime, Alt-A, and Prime. The share of subprime mortgages is shown in the diagram. It is the ratio of the dollar va |
ファイルの使用状況
以下の 2 ページがこのファイルを使用しています:
グローバルなファイル使用状況
以下に挙げる他のウィキがこの画像を使っています:
- de.wikipedia.org での使用状況
- el.wikipedia.org での使用状況
- en.wikipedia.org での使用状況
- fr.wikipedia.org での使用状況
- gu.wikipedia.org での使用状況
- hi.wikipedia.org での使用状況
- hy.wikipedia.org での使用状況
- it.wikipedia.org での使用状況
- kn.wikipedia.org での使用状況
- lt.wikipedia.org での使用状況
- ta.wikipedia.org での使用状況