ファイル:Vesuvius SRTM3.png
このプレビューのサイズ: 711 × 599 ピクセル。 その他の解像度: 285 × 240 ピクセル | 570 × 480 ピクセル | 942 × 794 ピクセル。
元のファイル (942 × 794 ピクセル、ファイルサイズ: 922キロバイト、MIME タイプ: image/png)
ウィキメディア・コモンズのファイルページにある説明を、以下に表示します。
|
概要
| 解説 |
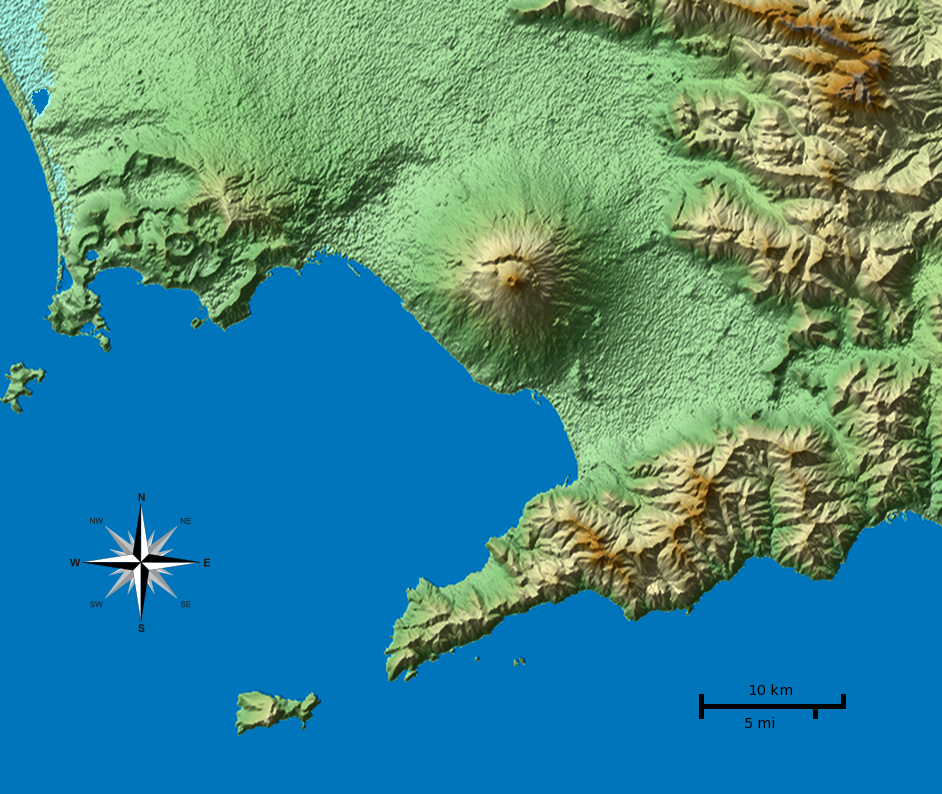
English: Shaded terrain map of the Naples and Mount Vesuvius region from SRTM3 elevation data. Each pixel corresponds to about 70x70 m. SRTM tile used was http://dds.cr.usgs.gov/srtm/version2_1/SRTM3/Eurasia/N40E014.hgt.zip. The top of the image is 41°N, the left side is 14°E.
|
| 日付 | |
| 原典 | 投稿者自身による著作物 |
| 作者 |
Morn the Gorn compass rose from Maps_template-fr.svg: Eric Gaba (Sting - fr:Sting) |
| その他のバージョン |
このファイルの派生的著作物: このファイルの派生元: Vesuvius SRTM3.xcf |
Code
SRTM data was plotted with the following Python 2 script (requires Python Imaging Library and NumPy) and then rescaled in Gimp to correct for the raw data aspect ratio at that latitude (about 92 m x 70 m). Terrain shading and hypsometric colors were combined in Gimp in layer multiply mode.
# Read SRTM3 file and create shaded relief

# 2010-04-05

from struct import unpack,calcsize

from numpy import *
import numpy as np
from PIL import Image

row_length = 1201	# row_length is 1201 for SRTM3 or 3601 for SRTM1
file_name  = "N40E014.hgt"	# from http://dds.cr.usgs.gov/srtm/version2_1/SRTM3/Eurasia/
hlim       = 800	# height limit for map [m]

ref_lat    = 40.55	# reference latitude
earth_eq   = 6371. * 1000. * 2. * pi
x_scale    = 1./360.*earth_eq*cos(ref_lat/180.*pi)/row_length
y_scale    = 1./360.*earth_eq/row_length

print "1 pixel = %u * %u m" % (x_scale, y_scale)
print "factor", y_scale/x_scale

h = zeros((row_length, row_length))
f = open(file_name, 'r')
li = []

for j in range(row_length):
	for i in range(row_length):
		d = f.read(2)
		(height,) = unpack('>h', d)
		h[i,j] = height
		if height < -1000:
			li.append((i,j))

hmax = h.max()
h3 = zeros_like(h)
h3[:,:] = h[:,:]
print len(li), "missing data points"

def get_nei(z):
	h2 = h[z[0]-1:z[0]+2,z[1]-1:z[1]+2]
	nn = sum(where(h2 < -1000, 0, 1))
	av = sum(where(h2 > -1000, h2, 0)) / float(nn)
	return nn, av

# fill missing points with a nearest-neighbor averaging method:
loop = len(li)
lim = 7
while loop > 0:
	sd = False
	for q in range(len(li)):
		if h[li[q]] > -1000.: continue
		n, a = get_nei(li[q])
		if n >= lim:
			print li[q],loop, n, a, lim
			h3[li[q]] = a
			loop -= 1
			sd = True
	if not sd: lim -= 1
	h[:,:] = h3[:,:]
print "missing points done"

def hext(a):
	"Hex color to triplet."
	r,g,b = a[0:2], a[2:4], a[4:6]
	return int(r, 16), int(g, 16), int(b, 16)

# from http://en.wikipedia.org/wiki/Wikipedia:WikiProject_Maps/Conventions/Topographic_maps:
col_sea = hext("0978ab")
cols = """
{{Mapcolor|r=245|v=244|b=242|hex=#F5F4F2|col=black}}
{{Mapcolor|r=224|v=222|b=216|hex=#E0DED8|col=black}}
{{Mapcolor|r=202|v=195|b=184|hex=#CAC3B8|col=black}}
{{Mapcolor|r=186|v=174|b=154|hex=#BAAE9A|col=black}}
{{Mapcolor|r=172|v=154|b=124|hex=#AC9A7C|col=black}}
{{Mapcolor|r=170|v=135|b=83|hex=#AA8753|col=black}}
{{Mapcolor|r=185|v=152|b=90|hex=#B9985A|col=black}}
{{Mapcolor|r=195|v=167|b=107|hex=#C3A76B|col=black}}
{{Mapcolor|r=202|v=185|b=130|hex=#CAB982|col=black}}
{{Mapcolor|r=211|v=202|b=157|hex=#D3CA9D|col=black}}
{{Mapcolor|r=222|v=214|b=163|hex=#DED6A3|col=black}}
{{Mapcolor|r=232|v=225|b=182|hex=#E8E1B6|col=black}}
{{Mapcolor|r=239|v=235|b=192|hex=#EFEBC0|col=black}}
{{Mapcolor|r=225|v=228|b=181|hex=#E1E4B5|col=black}}
{{Mapcolor|r=209|v=215|b=171|hex=#D1D7AB|col=black}}
{{Mapcolor|r=189|v=204|b=150|hex=#BDCC96|col=black}}
{{Mapcolor|r=168|v=198|b=143|hex=#A8C68F|col=black}}
{{Mapcolor|r=148|v=191|b=139|hex=#94BF8B|col=black}}
{{Mapcolor|r=172|v=208|b=165|hex=#ACD0A5|col=black}}
"""
col = []

for l in cols.splitlines():
	if len(l) < 10: continue
	i = l.find('#')
	if i > -1:
		col.append(hext(l[i+1:i+7]))

col.reverse()	# -> bottom to top

o = Image.new('RGB', h.shape)

def interp(c, f):
	"Interpolate into color table."
	r = int((1.-f) * col[c][0] + f * col[c+1][0])
	g = int((1.-f) * col[c][1] + f * col[c+1][1])
	b = int((1.-f) * col[c][2] + f * col[c+1][2])
	return r,g,b

for j in range(row_length):
	for i in range(row_length):
		c, f = divmod(h[j,i] / hmax * (len(col)-1), 1)
		if 0 < h[j,i] < hmax:
			o.putpixel((j,i), interp(int(c), f))
		elif h[i,j] == hmax:
			o.putpixel((j,i), col[-1])
		else: o.putpixel((j,i), col_sea)

o.save("map_height.png")	# save height map
o2 = o.crop((0,0,942,603))
o2.save("map_height_cropped.png")

# taken from hillshade.py:
#def illumination(idata,azdeg=315.0,altdeg=45.):
def illumination(idata,azdeg=225.0,altdeg=45.):
    # convert alt, az to radians
    az = azdeg*np.pi/180.0
    alt = altdeg*np.pi/180.0
    # gradient in x and y directions
    dx, dy = np.gradient(idata)
    slope = 0.5*np.pi - np.arctan(np.hypot(dx, dy))
    aspect = np.arctan2(dx, dy)
    odata = np.sin(alt)*np.sin(slope) + np.cos(alt)*np.cos(slope)*np.cos(-az -\
             aspect - 0.5*np.pi)
    # rescale to interval -1,1
    # 1 means maximum sun exposure and 0 means complete shade.
    odata = (odata - odata.min())/(odata.max() - odata.min())
    return odata

il = 255 * illumination(h)

o4 = Image.new('RGBA', il.shape)
for j in range(row_length-1):
	for i in range(row_length-1):
		v = int(il[j,i])
		if 0 <= v < 128:
			alpha = (255 - 2*v)
			o4.putpixel((j,i), (0,0,0,alpha))
		elif v == 128:
			o4.putpixel((j,i), (0,0,0,0))
		elif 128 < v < 256:
			alpha = 2*(v-128)
			o4.putpixel((j,i), (255,255,255,alpha))
		else:
			o4.putpixel((j,i), (255,255,255,0))
o4.save("il_NW_alpha.png")	# NW-illuminated (alpha transparency for use with Inkscape)
ライセンス
この作品の著作権者である私は、この作品を以下のライセンスで提供します。
このファイルはクリエイティブ・コモンズ 表示-継承 3.0 非移植ライセンスのもとに利用を許諾されています。
- あなたは以下の条件に従う場合に限り、自由に
- 共有 – 本作品を複製、頒布、展示、実演できます。
- 再構成 – 二次的著作物を作成できます。
- あなたの従うべき条件は以下の通りです。
- 表示 – あなたは適切なクレジットを表示し、ライセンスへのリンクを提供し、変更があったらその旨を示さなければなりません。これらは合理的であればどのような方法で行っても構いませんが、許諾者があなたやあなたの利用行為を支持していると示唆するような方法は除きます。
- 継承 – もしあなたがこの作品をリミックスしたり、改変したり、加工した場合には、あなたはあなたの貢献部分を元の作品とこれと同一または互換性があるライセンスの下に頒布しなければなりません。

|
この文書は、フリーソフトウェア財団発行のGNUフリー文書利用許諾書 (GNU Free Documentation License) 1.2またはそれ以降のバージョンの規約に基づき、複製や再配布、改変が許可されます。不可変更部分、表紙、背表紙はありません。このライセンスの複製は、GNUフリー文書利用許諾書という章に含まれています。 |
あなたは上記のライセンスから、どれか一つ以上を選択できます。
| 注釈 | この画像には注釈がついています: コモンズで注釈を見る |
ファイルの履歴
過去の版のファイルを表示するには、その版の日時をクリックしてください。
| 日付と時刻 | サムネイル | 寸法 | 利用者 | コメント | |
|---|---|---|---|---|---|
| 現在の版 | 2010年4月5日 (月) 01:01 | | 942 × 794 (922キロバイト) | Morn | corrected color of a lake |
| 2010年4月5日 (月) 00:56 |  | 942 × 794 (1.01メガバイト) | Morn | removed artifacts in shadows | |
| 2010年4月4日 (日) 19:06 |  | 942 × 794 (908キロバイト) | Morn | compass rose | |
| 2010年4月4日 (日) 14:49 |  | 942 × 794 (899キロバイト) | Morn | removed slight banding in the water | |
| 2010年4月4日 (日) 14:41 |  | 942 × 794 (904キロバイト) | Morn | color version | |
| 2010年4月4日 (日) 12:18 |  | 942 × 794 (750キロバイト) | Morn | scale | |
| 2010年4月3日 (土) 20:55 |  | 942 × 794 (652キロバイト) | Morn | {{Information |Description={{en|1=Shaded terrain image of the Naples and Mount Vesuvius region from SRTM3 data. Each pixel corresponds to about 70x70 m.}} |Source={{own}} |Author=Morn the Gorn |Date=2010-03-04 |Permission= |other_ve |
ファイルの使用状況
グローバルなファイル使用状況
以下に挙げる他のウィキがこの画像を使っています:
- ast.wikipedia.org での使用状況
- as.wikipedia.org での使用状況
- cs.wikipedia.org での使用状況
- en.wikipedia.org での使用状況
- eo.wikivoyage.org での使用状況
- es.wikipedia.org での使用状況
- et.wikipedia.org での使用状況
- fy.wikipedia.org での使用状況
- hu.wikipedia.org での使用状況
- hyw.wikipedia.org での使用状況
- id.wikipedia.org での使用状況
- it.wikipedia.org での使用状況
- it.wikibooks.org での使用状況
- it.wikiversity.org での使用状況
- ka.wikipedia.org での使用状況
- ko.wikipedia.org での使用状況
- la.wikipedia.org での使用状況
- nl.wikipedia.org での使用状況
- nn.wikipedia.org での使用状況
- oc.wikipedia.org での使用状況
- ro.wikipedia.org での使用状況
- simple.wikipedia.org での使用状況
- sr.wikipedia.org での使用状況
- tl.wikipedia.org での使用状況
- tr.wikipedia.org での使用状況
- vi.wikipedia.org での使用状況
- zh.wikipedia.org での使用状況