ファイル:Harmonic oscillator gain.svg

この SVG ファイルのこの PNG プレビューのサイズ: 800 × 600 ピクセル. その他の解像度: 320 × 240 ピクセル | 640 × 480 ピクセル | 1,024 × 768 ピクセル | 1,280 × 960 ピクセル | 2,560 × 1,920 ピクセル。
元のファイル (SVG ファイル、1,024 × 768 ピクセル、ファイルサイズ: 20キロバイト)
ウィキメディア・コモンズのファイルページにある説明を、以下に表示します。
|
概要
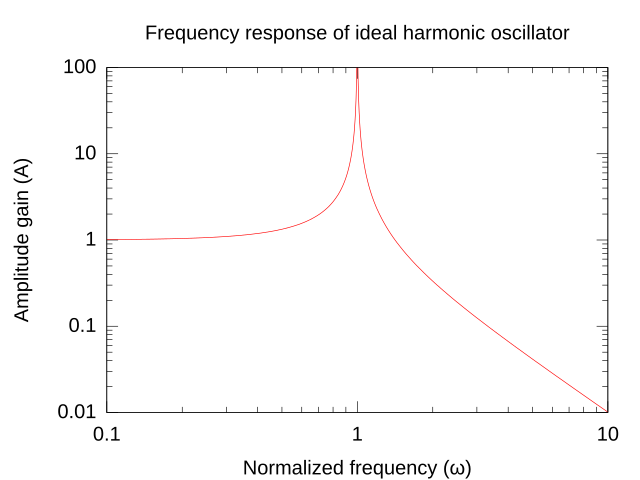
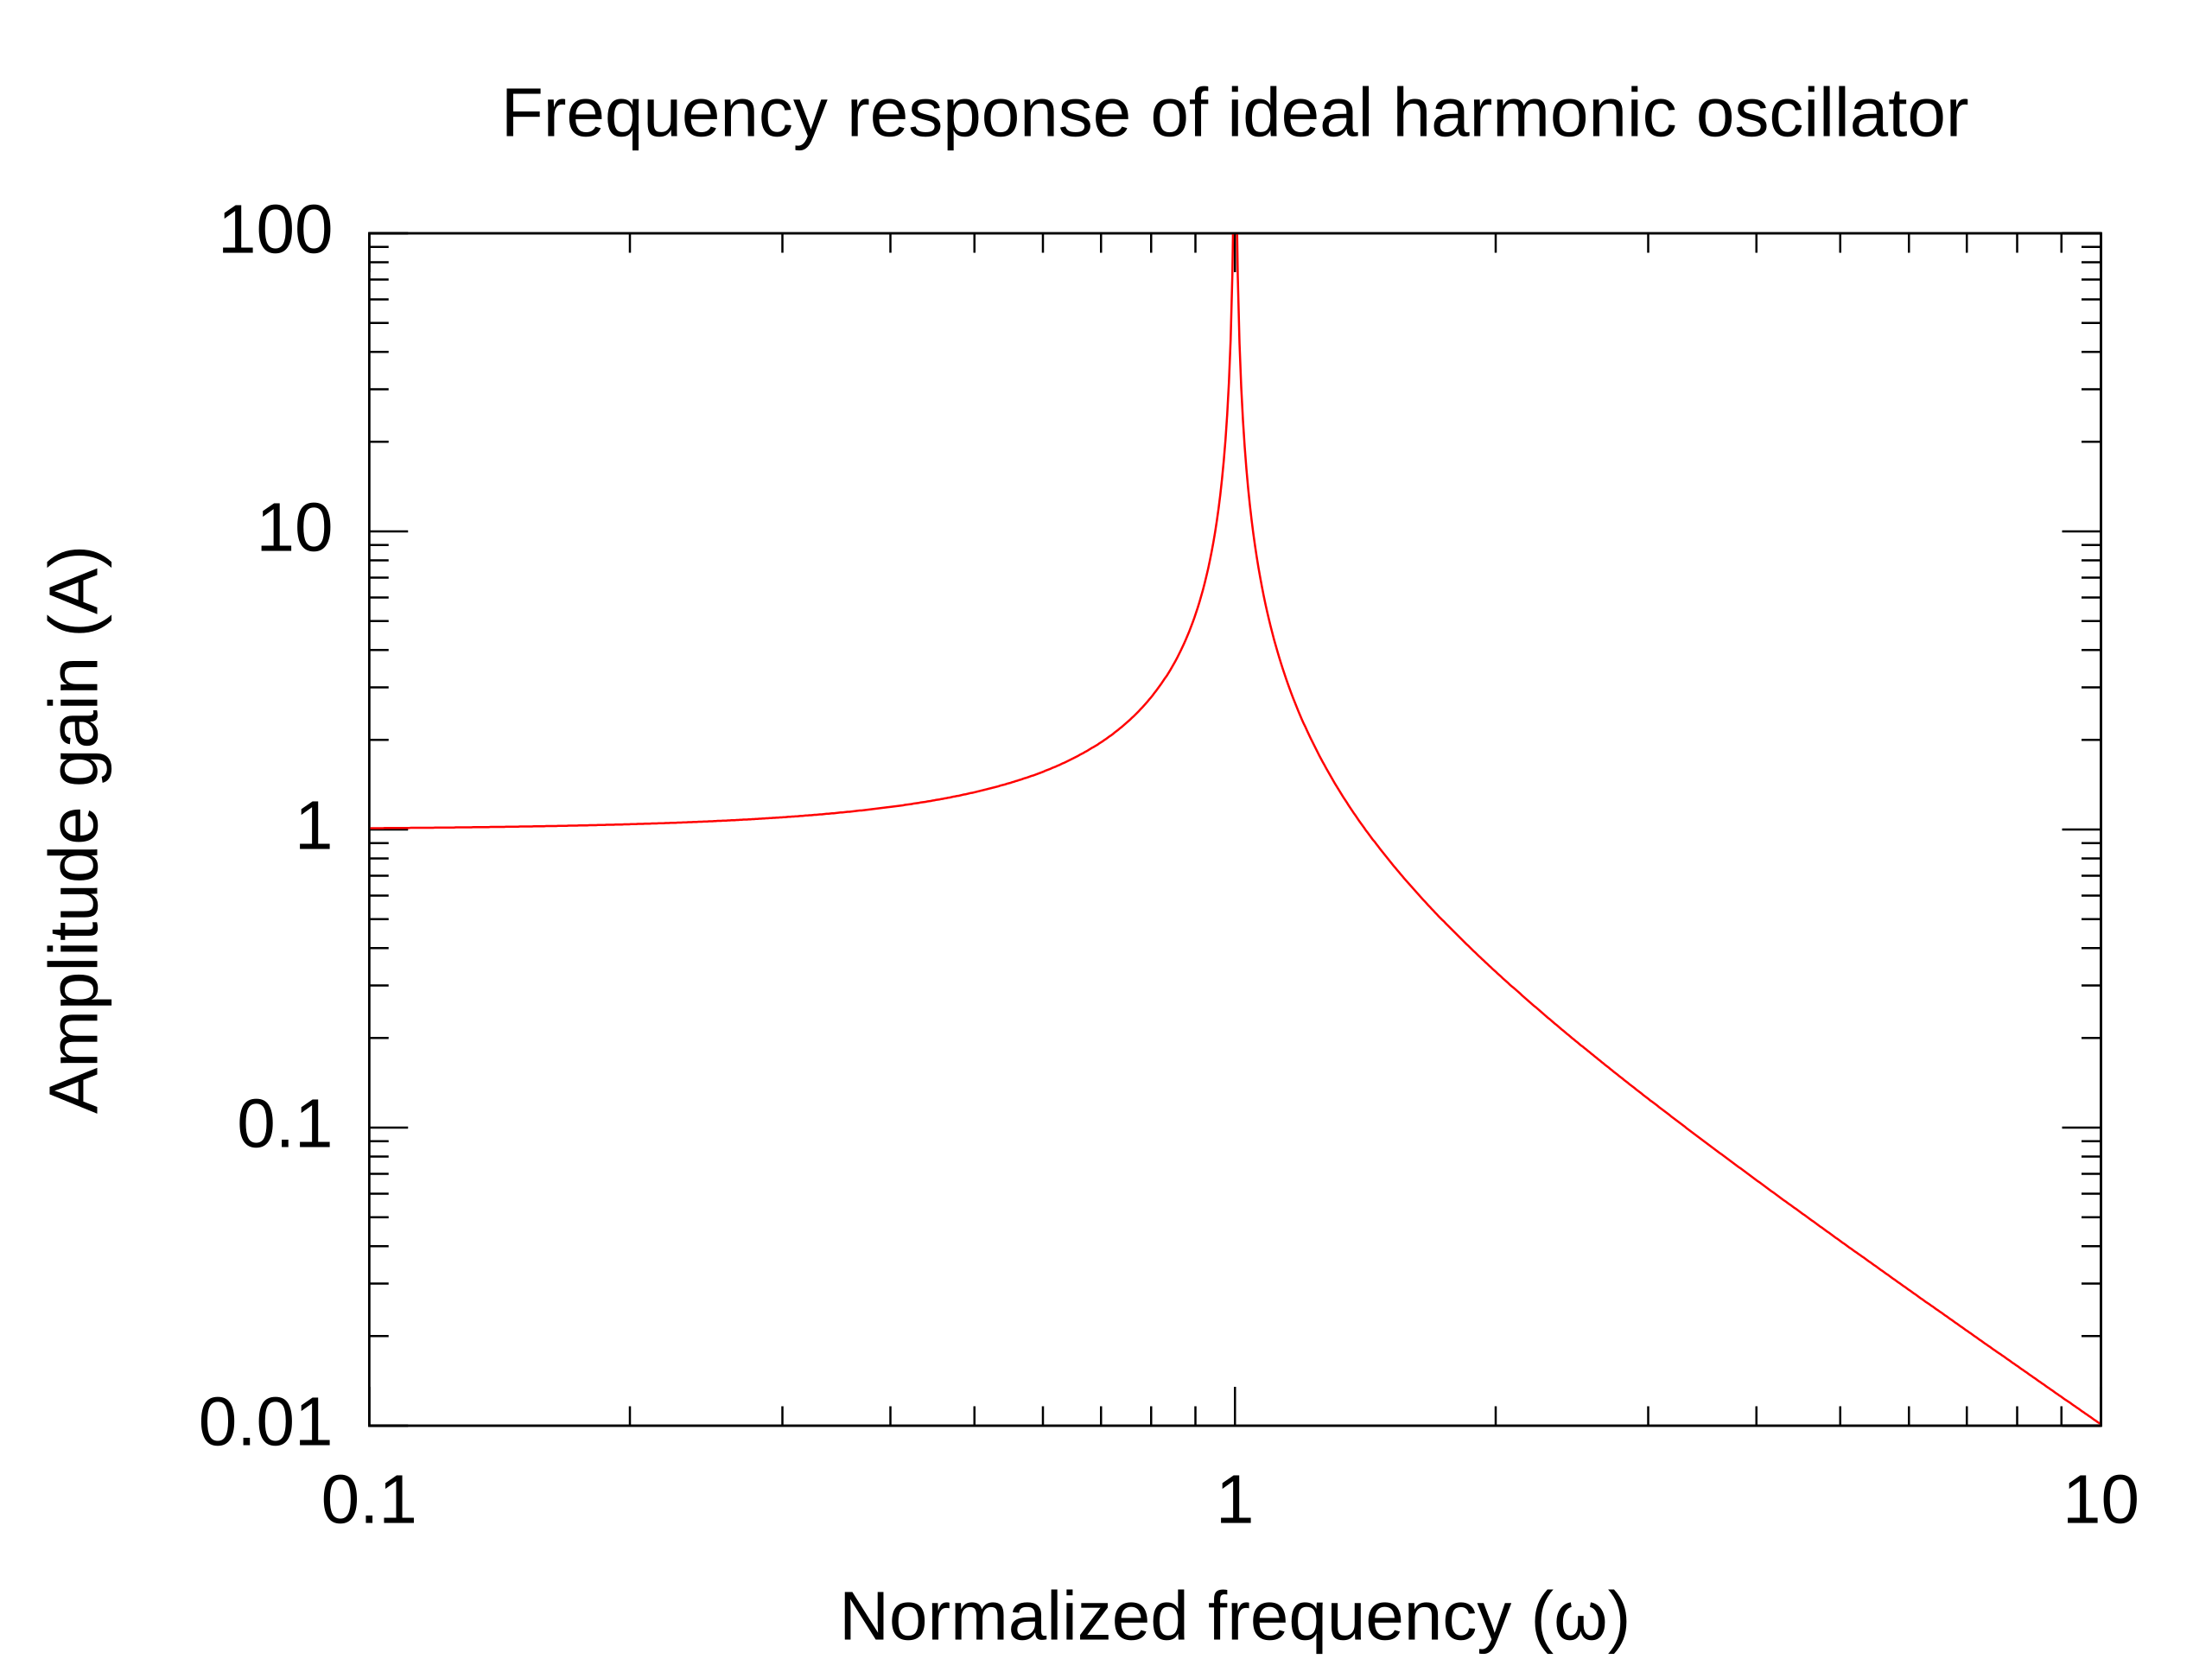
| 解説 | Log-log plot of the frequency response of an ideal harmonic oscillator, made with Gnuplot. The three sections of the graph can be understood as follows: Below resonance, the gain is approximately one, because the oscillator simply follows the driving force, neither amplifying nor attenuating it. Near resonance, the energy builds up inside the oscillator and the gain reaches a maximum (in a real oscillator, the height and sharpness of the peak are limited by the Q factor). At higher frequencies, the oscillator cannot "keep up with" the rapidly varying driving force, so the signal is attenuated more and more (and also shifted 180 degrees out of phase). |
| 日付 | |
| 原典 | 投稿者自身による著作物 |
| 作者 | Keenan Pepper |
ライセンス
| この著作物の著作権者である私は、この著作物における権利を放棄しパブリックドメインとします。これは全世界で適用されます。 一部の国では、これが法的に可能ではない場合があります。その場合は、次のように宣言します。 私は、あらゆる人に対して、法により必要とされている条件を除き、如何なる条件も課すことなく、あらゆる目的のためにこの著作物を使用する権利を与えます。 |
ファイルの履歴
過去の版のファイルを表示するには、その版の日時をクリックしてください。
| 日付と時刻 | サムネイル | 寸法 | 利用者 | コメント | |
|---|---|---|---|---|---|
| 現在の版 | 2008年5月11日 (日) 18:35 | | 1,024 × 768 (20キロバイト) | Keenan Pepper | larger font |
| 2008年5月11日 (日) 18:33 |  | 1,024 × 768 (20キロバイト) | Keenan Pepper | {{Information |Description=Log-log plot of the frequency response of an ideal harmonic oscillator, made with Gnuplot. The three sections of the graph can be understood as follows: Below resonance, the gain is approximately one, because the oscillator simp |
ファイルの使用状況
以下のページがこのファイルを使用しています:
グローバルなファイル使用状況
以下に挙げる他のウィキがこの画像を使っています:
- en.wikipedia.org での使用状況
- mk.wikipedia.org での使用状況
- pt.wikipedia.org での使用状況
- zh.wikipedia.org での使用状況