ファイル:Karmarkar.svg

この SVG ファイルのこの PNG プレビューのサイズ: 720 × 540 ピクセル. その他の解像度: 320 × 240 ピクセル | 640 × 480 ピクセル | 1,024 × 768 ピクセル | 1,280 × 960 ピクセル | 2,560 × 1,920 ピクセル。
元のファイル (SVG ファイル、720 × 540 ピクセル、ファイルサイズ: 43キロバイト)
ウィキメディア・コモンズのファイルページにある説明を、以下に表示します。
|
概要
| 解説 |
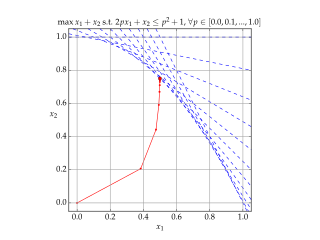
English: Solution of example LP in Karmarkar's algorithm.
Blue lines show the constraints, Red shows each iteration of the algorithm. |
| 日付 | |
| 原典 | 投稿者自身による著作物 |
| 作者 | Gjacquenot |
ライセンス
この作品の著作権者である私は、この作品を以下のライセンスで提供します。
このファイルはクリエイティブ・コモンズ 表示-継承 4.0 国際ライセンスのもとに利用を許諾されています。
- あなたは以下の条件に従う場合に限り、自由に
- 共有 – 本作品を複製、頒布、展示、実演できます。
- 再構成 – 二次的著作物を作成できます。
- あなたの従うべき条件は以下の通りです。
- 表示 – あなたは適切なクレジットを表示し、ライセンスへのリンクを提供し、変更があったらその旨を示さなければなりません。これらは合理的であればどのような方法で行っても構いませんが、許諾者があなたやあなたの利用行為を支持していると示唆するような方法は除きます。
- 継承 – もしあなたがこの作品をリミックスしたり、改変したり、加工した場合には、あなたはあなたの貢献部分を元の作品とこれと同一または互換性があるライセンスの下に頒布しなければなりません。
Source code (Python)
#!/usr/bin/env python
# -*- coding: utf-8 -*-
#
# Python script to illustrate the convergence of Karmarkar's algorithm on
# a linear programming problem.
#
# http://en.wikipedia.org/wiki/Karmarkar%27s_algorithm
#
# Karmarkar's algorithm is an algorithm introduced by Narendra Karmarkar in 1984
# for solving linear programming problems. It was the first reasonably efficient
# algorithm that solves these problems in polynomial time.
#
# Karmarkar's algorithm falls within the class of interior point methods: the
# current guess for the solution does not follow the boundary of the feasible
# set as in the simplex method, but it moves through the interior of the feasible
# region, improving the approximation of the optimal solution by a definite
# fraction with every iteration, and converging to an optimal solution with
# rational data.
#
# Guillaume Jacquenot
# 2015-05-03
# CC-BY-SA

import numpy as np
import matplotlib
from matplotlib.pyplot import figure, show, rc, grid

class ProblemInstance():
    def __init__(self):
        n = 2
        m = 11
        self.A = np.zeros((m,n))
        self.B = np.zeros((m,1))
        self.C = np.array([[1],[1]])
        self.A[:,1] = 1
        for i in range(11):
            p = 0.1*i
            self.A[i,0] = 2.0*p
            self.B[i,0] = p*p + 1.0

class KarmarkarAlgorithm():
    def __init__(self,A,B,C):
        self.maxIterations = 100
        self.A = np.copy(A)
        self.B = np.copy(B)
        self.C = np.copy(C)
        self.n = len(C)
        self.m = len(B)
        self.AT = A.transpose()
        self.XT = None

    def isConvergeCriteronSatisfied(self, epsilon = 1e-8):
        if np.size(self.XT,1)<2:
            return False
        if np.linalg.norm(self.XT[:,-1]-self.XT[:,-2],2) < epsilon:
            return True

    def solve(self, X0=None):
        # No check is made for unbounded problem
        if X0 is None:
            X0 = np.zeros((self.n,1))
        k = 0
        X = np.copy(X0)
        self.XT = np.copy(X0)
        gamma = 0.5
        for _ in range(self.maxIterations):
            if self.isConvergeCriteronSatisfied():
                break
            V = self.B-np.dot(self.A,X)
            VM2 = np.linalg.matrix_power(np.diagflat(V),-2)
            hx = np.dot(np.linalg.matrix_power(np.dot(np.dot(self.AT,VM2),self.A),-1),self.C)
            hv = -np.dot(self.A,hx)
            coeff = np.infty
            for p in range(self.m):
                if hv[p,0]<0:
                    coeff = np.min((coeff,-V[p,0]/hv[p,0]))
            alpha = gamma * coeff
            X += alpha*hx
            self.XT = np.concatenate((self.XT,X),axis=1)

    def makePlot(self,outputFilename = r'Karmarkar.svg', xs=-0.05, xe=+1.05):
        rc('grid', linewidth = 1, linestyle = '-', color = '#a0a0a0')
        rc('xtick', labelsize = 15)
        rc('ytick', labelsize = 15)
        rc('font',**{'family':'serif','serif':['Palatino'],'size':15})
        rc('text', usetex=True)

        fig = figure()
        ax = fig.add_axes([0.12, 0.12, 0.76, 0.76])
        grid(True)
        ylimMin = -0.05
        ylimMax = +1.05
        xsOri = xs
        xeOri = xe
        for i in range(np.size(self.A,0)):
            xs = xsOri
            xe = xeOri
            a = -self.A[i,0]/self.A[i,1]
            b = +self.B[i,0]/self.A[i,1]
            ys = a*xs+b
            ye = a*xe+b
            if ys>ylimMax:
                ys = ylimMax
                xs = (ylimMax-b)/a
            if ye<ylimMin:
                ye = ylimMin
                xe = (ylimMin-b)/a
            ax.plot([xs,xe], [ys,ye], \
                    lw = 1, ls = '--', color = 'b')
        ax.set_xlim((xs,xe))
        ax.plot(self.XT[0,:], self.XT[1,:], \
                lw = 1, ls = '-', color = 'r', marker = '.')
        ax.plot(self.XT[0,-1], self.XT[1,-1], \
                lw = 1, ls = '-', color = 'r', marker = 'o')
        ax.set_xlim((ylimMin,ylimMax))
        ax.set_ylim((ylimMin,ylimMax))
        ax.set_aspect('equal')
        ax.set_xlabel('$x_1$',rotation = 0)
        ax.set_ylabel('$x_2$',rotation = 0)
        ax.set_title(r'$\max x_1+x_2\textrm{ s.t. }2px_1+x_2\le p^2+1\textrm{, }\forall p \in [0.0,0.1,...,1.0]$',
                     fontsize=15)
        fig.savefig(outputFilename)
        fig.show()

if __name__ == "__main__":
    p = ProblemInstance()
    k = KarmarkarAlgorithm(p.A,p.B,p.C)
    k.solve(X0 = np.zeros((2,1)))
    k.makePlot(outputFilename = r'Karmarkar.svg', xs=-0.05, xe=+1.05)
ファイルの履歴
過去の版のファイルを表示するには、その版の日時をクリックしてください。
| 日付と時刻 | サムネイル | 寸法 | 利用者 | コメント | |
|---|---|---|---|---|---|
| 現在の版 | 2017年11月22日 (水) 15:34 | | 720 × 540 (43キロバイト) | DutchCanadian | The right hand side for the constraints appears to be p<sup>2</sup>+1, rather than p<sup>2</sup>, going by both the plot and the code (note the line <tt>self.B[i,0] = p*p + 1.0</tt>). Updated the header line. |
| 2015年5月3日 (日) 19:29 |  | 720 × 540 (41キロバイト) | Gjacquenot | Updated constraint display | |
| 2015年5月3日 (日) 19:26 |  | 720 × 540 (41キロバイト) | Gjacquenot | Updated constraint display | |
| 2015年5月3日 (日) 19:17 |  | 720 × 540 (41キロバイト) | Gjacquenot | Updated constraint display | |
| 2015年5月3日 (日) 18:54 |  | 720 × 540 (41キロバイト) | Gjacquenot | User created page with UploadWizard |
ファイルの使用状況
以下のページがこのファイルを使用しています:
グローバルなファイル使用状況
以下に挙げる他のウィキがこの画像を使っています:
- ar.wikipedia.org での使用状況
- en.wikipedia.org での使用状況
- fr.wikipedia.org での使用状況
- ko.wikipedia.org での使用状況
- pt.wikipedia.org での使用状況
- ru.wikipedia.org での使用状況
- simple.wikipedia.org での使用状況
- uk.wikipedia.org での使用状況
- zh.wikipedia.org での使用状況