ファイル:LogisticMap BifurcationDiagram.png

このプレビューのサイズ: 800 × 566 ピクセル。 その他の解像度: 320 × 226 ピクセル | 640 × 453 ピクセル | 1,024 × 724 ピクセル | 1,280 × 905 ピクセル | 1,838 × 1,300 ピクセル。
元のファイル (1,838 × 1,300 ピクセル、ファイルサイズ: 571キロバイト、MIME タイプ: image/png)
ファイルの履歴
過去の版のファイルを表示するには、その版の日時をクリックしてください。
| 日付と時刻 | サムネイル | 寸法 | 利用者 | コメント | |
|---|---|---|---|---|---|
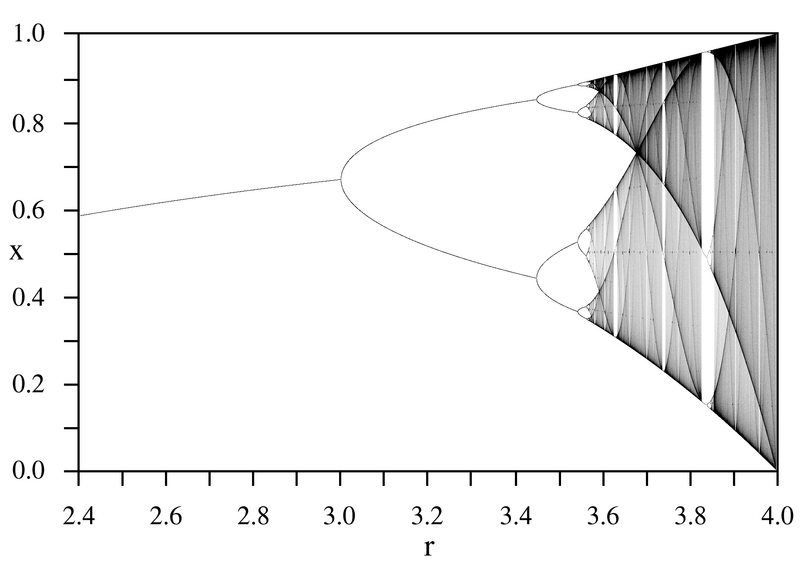
| 現在の版 | 2005年9月14日 (水) 00:11 |  | 1,838 × 1,300 (571キロバイト) | PAR~commonswiki | Bifurcation diagram for the logistic map for parameter r=2.4 to 4.0. |
ファイルの使用状況
以下の 2 ページがこのファイルを使用しています:
グローバルなファイル使用状況
以下に挙げる他のウィキがこの画像を使っています:
- ar.wikipedia.org での使用状況
- ca.wikipedia.org での使用状況
- da.wikipedia.org での使用状況
- de.wikipedia.org での使用状況
- el.wikipedia.org での使用状況
- en.wikipedia.org での使用状況
- Talk:Bifurcation diagram
- Talk:Logistic map
- Mitchell Feigenbaum
- Portal:Mathematics/Featured picture archive
- Recurrence quantification analysis
- Portal:Mathematics/Suggestions
- Wikipedia:WikiProject Systems/List of images of systems
- User:Kiefer.Wolfowitz
- Wikipedia talk:WikiProject Mathematics/Archive/2011
- Ivar Ekeland
- Wikipedia talk:WikiProject Mathematics/Archive/2011/Apr
- User talk:Kiefer.Wolfowitz/Archive 9
- Portal:Mathematics/Featured picture/2011 12
- User:RazrRekr201/Table of constants
- Mathematical constant
- en.wikibooks.org での使用状況
- en.wikiversity.org での使用状況
- eo.wikipedia.org での使用状況
- es.wikipedia.org での使用状況
- fi.wikipedia.org での使用状況
- fr.wikipedia.org での使用状況
- fr.wikiversity.org での使用状況
- he.wikipedia.org での使用状況
このファイルのグローバル使用状況を表示する。

