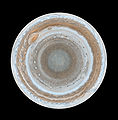
ファイル:Map of Jupiter.jpg

このプレビューのサイズ: 590 × 599 ピクセル。 その他の解像度: 236 × 240 ピクセル | 473 × 480 ピクセル | 756 × 768 ピクセル | 1,008 × 1,024 ピクセル | 2,231 × 2,266 ピクセル。
元のファイル (2,231 × 2,266 ピクセル、ファイルサイズ: 426キロバイト、MIME タイプ: image/jpeg)
ファイルの履歴
過去の版のファイルを表示するには、その版の日時をクリックしてください。
| 日付と時刻 | サムネイル | 寸法 | 利用者 | コメント | |
|---|---|---|---|---|---|
| 現在の版 | 2007年2月14日 (水) 10:59 |  | 2,231 × 2,266 (426キロバイト) | Helix84 | {{en| :This map of Jupiter is the most detailed global color map of the planet ever produced. The round map is a polar stereographic projection that shows the south pole in the center of the map and the equator at the edge. It was constructed from images |
ファイルの使用状況
グローバルなファイル使用状況
以下に挙げる他のウィキがこの画像を使っています:
- af.wikipedia.org での使用状況
- ar.wikipedia.org での使用状況
- bn.wikipedia.org での使用状況
- ca.wikipedia.org での使用状況
- de.wikipedia.org での使用状況
- en.wikipedia.org での使用状況
- Jupiter
- Wikipedia:Featured pictures thumbs/05
- Wikipedia:Featured picture candidates/October-2006
- Wikipedia:Featured picture candidates/Map of Jupiter
- User:Andonic/Successful Featured Picture Nominations
- Wikipedia:Featured picture candidates/January-2007
- Wikipedia:Featured picture candidates/Polar Map of Jupiter
- Wikipedia:Wikipedia Signpost/2007-01-15/Features and admins
- Wikipedia:Wikipedia Signpost/2007-01-15/SPV
- User talk:Andonic/Archive 7
- Wikipedia:WikiProject Astronomy/Recognized content
- Portal:Solar System
- Portal:Solar System/Selected article
- Portal:Solar System/Selected picture
- Wikipedia:Picture of the day/May 2007
- Template:POTD/2007-05-10
- User talk:Andonic/Archive 11
- Portal:Solar System/Selected picture/11
- Wikipedia:Featured pictures/Space/Looking out
- Wikipedia:Today's featured article/August 2009
- Wikipedia:Today's featured article/August 25, 2009
- Portal:Solar System/Selected article/21
- Talk:Jupiter/Archive 5
- Atmosphere of Jupiter
- Wikipedia:WikiProject Astronomy/Recognized astronomy content
- Wikipedia:Wikipedia Signpost/Single/2007-01-15
- es.wikipedia.org での使用状況
- eu.wikipedia.org での使用状況
- fr.wikipedia.org での使用状況
- it.wikipedia.org での使用状況
- kn.wikipedia.org での使用状況
- la.wikipedia.org での使用状況
- mk.wikipedia.org での使用状況
- nds.wikipedia.org での使用状況
- no.wikipedia.org での使用状況
このファイルのグローバル使用状況を表示する。


