ファイル:Bmi30chart.png
このプレビューのサイズ: 800 × 455 ピクセル。 その他の解像度: 320 × 182 ピクセル | 640 × 364 ピクセル | 1,024 × 582 ピクセル | 1,600 × 910 ピクセル。
元のファイル (1,600 × 910 ピクセル、ファイルサイズ: 55キロバイト、MIME タイプ: image/png)
ウィキメディア・コモンズのファイルページにある説明を、以下に表示します。
|
概要
| 解説 |
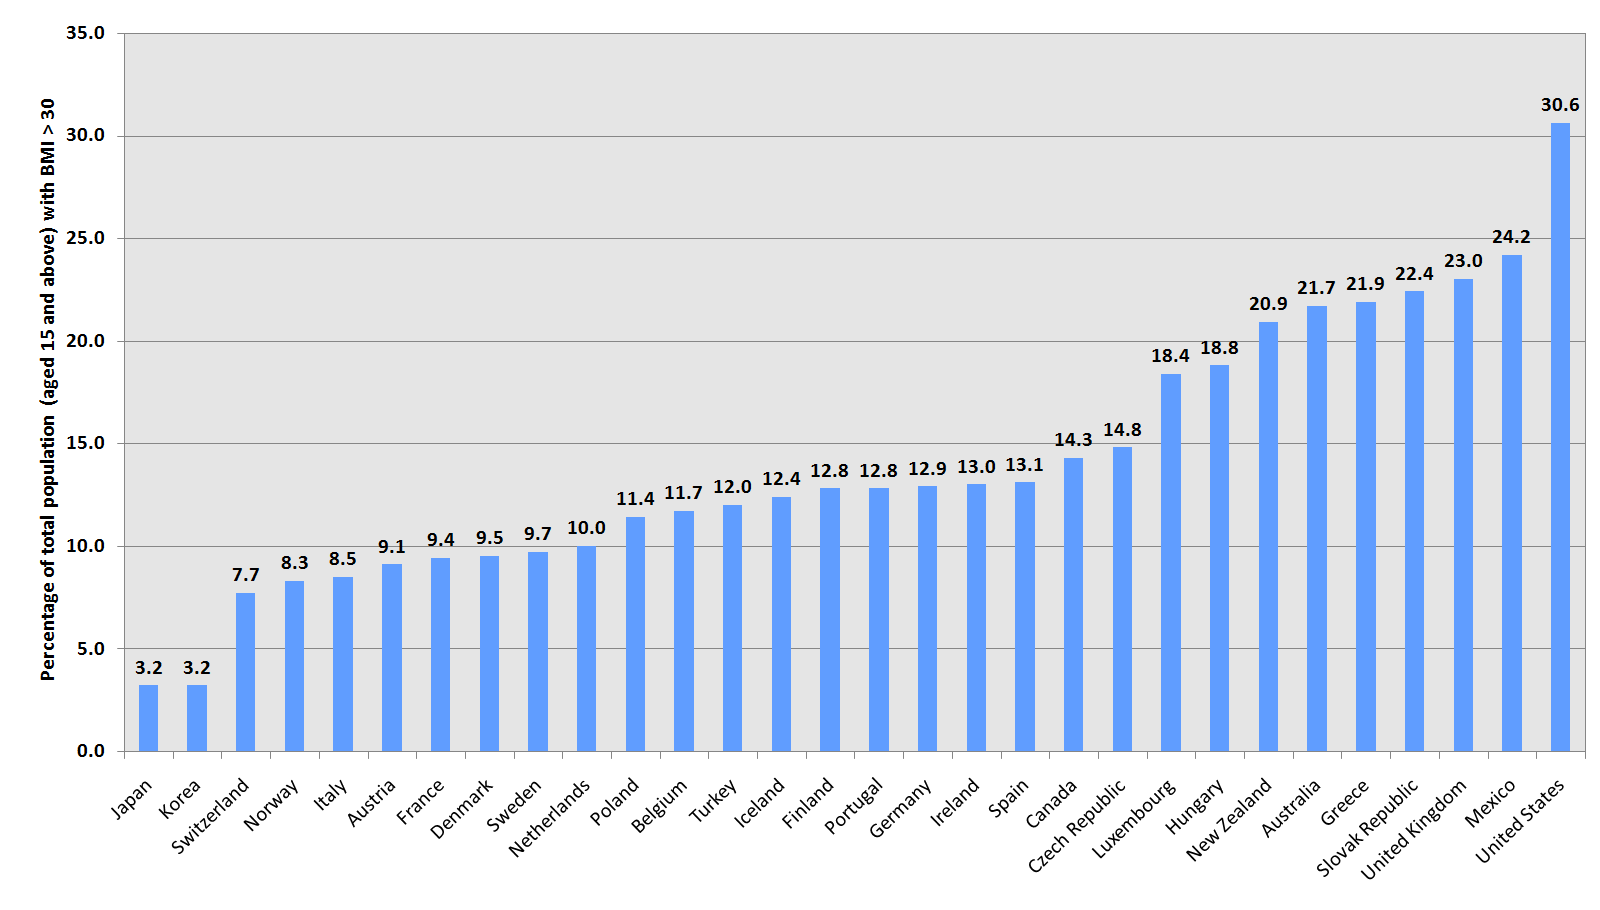
English: This chart compares figures in the population of OECD countries (plus the Czech Republic, Hungary, Poland, Slovakia and Mexico); it shows the percentage of total population (aged 15 and above) with a body mass index greater than 30. The year the figures used for this chart were published, collected or compiled range from 1996 to 2003. Exact years for each country can be found in the documents linked below. |
| 日付 | 2005年5月25日 (当初のアップロード日) |
| 原典 |
Graphic chart created by User:Phils using Microsoft Excel 2004 (Mac) and OECD data available for download and discussed here. The actual data was extracted from an Excel data sheet downloadable here, which contains the following source information:
|
| 作者 | 英語版ウィキペディアのPhilsさん |
| その他のバージョン | An alternate copyrighted graph of the same data, published by OECD can be viewed here. |
ライセンス
| このファイルはクリエイティブ・コモンズ 表示-継承 3.0 非移植ライセンスのもとに利用を許諾されています。 著作権に示した解釈の下ライセンスされるものとします。 | ||
| ||
| このライセンスのテンプレートは、GFDLのライセンス・アップデートによりこのファイルに追加されたものです。 |

|
この文書は、フリーソフトウェア財団発行のGNUフリー文書利用許諾書 (GNU Free Documentation License) 1.2またはそれ以降のバージョンの規約に基づき、複製や再配布、改変が許可されます。不可変更部分、表紙、背表紙はありません。このライセンスの複製は、GNUフリー文書利用許諾書という章に含まれています。 著作権に示した解釈の下ライセンスされるものとします。 |
元のアップロードログ
元のファイルページはこちら。以下の利用者は全てen.wikipediaに属します。
- 2007-03-24 22:42 AtilimGunesBaydin 1600×910× (56622 bytes) Updated with current data from OECD. Added Greece and Turkey existing in the OECD publication and original graph, but missing in the user-created version. Also minor changes in the order of countries.
- 2005-05-25 14:10 Phils 1467×901× (122414 bytes) {{GFDL}} This chart compares obesity figures in the population of OECD countries; it shows the percentage of total population (aged 15 and above) with a body-mass index greater than 30. The year the figures used for this chart were published, collected or
- 2005-05-25 10:46 Phils 0×0× (7028 bytes) {{GFDL}} This chart compares obesity figures in the population of OECD countries; it shows the percentage of total population (aged 15 and above) with a body-mass index greater than 30. The year the figures used for this chart were published, collected or (version lost by MediaWiki)
ファイルの履歴
過去の版のファイルを表示するには、その版の日時をクリックしてください。
| 日付と時刻 | サムネイル | 寸法 | 利用者 | コメント | |
|---|---|---|---|---|---|
| 現在の版 | 2012年9月10日 (月) 16:34 | | 1,600 × 910 (55キロバイト) | OgreBot | (BOT): Uploading old version of file from en.wikipedia; originally uploaded on 2007-03-24 22:42:19 by AtilimGunesBaydin |
| 2006年5月4日 (木) 17:11 |  | 1,467 × 901 (120キロバイト) | Deprifry | This chart compares obesity figures in the population of OECD countries; it shows the percentage of total population (aged 15 and above) with a body-mass index greater than 30. The year the figures used for this chart were published, collected or compiled |
ファイルの使用状況
以下の 3 ページがこのファイルを使用しています:
グローバルなファイル使用状況
以下に挙げる他のウィキがこの画像を使っています:
- ast.wikipedia.org での使用状況
- de.wikipedia.org での使用状況
- en.wikipedia.org での使用状況
- en.wikinews.org での使用状況
- fi.wikipedia.org での使用状況
- fr.wikipedia.org での使用状況
- it.wikipedia.org での使用状況
- simple.wikipedia.org での使用状況
- sr.wikipedia.org での使用状況